To investigate the effect of hypertension on 10-year prognosis in T2DM after 10-year multi-factorial management. In Beijing Community Diabetes Study (BCDS), 246 patients with Type 2 diabetes (T2DM) were enrolled from Zuojiazhuang community in Beijing in 2008. Based on combined hypertension or not, the patients were divided into simple T2DM (DM group) and T2DM combined with hypertension (DM + HTN group). All patients received the multi-factorial intervention for 10 years. The clinical features and occurrences of endpoint events were evaluated at the end of follow-up in 2018. During the 10-year follow-up, the incidence of cardio-cerebrovascular events in DM+HTN group (23 cases, 13.29%) was significant higher than that of the DM group (47 cases, 2.13%). In Cox multivariate analysis, hypertension had important effect on cardio-cerebrovascular endpoint events risk (HR:7.63,95%CI:1.04−6.22). Kaplan-Merier curve showed significant difference in survival curves between the two groups (P<0.05). In conclusions, the incidence of the cardio-cerebrovascular events in T2DM with hypertension is 7.63 times higher than that of simple T2DM. Hypertension is associated with a worse 10-year prognosis in T2DM.
Type 2 diabetes (T2DM); Hypertension; Compound Endpoint Events; Health Control; Community
Trial Registration:
ChiCTR-TRC-13003978, ChiCTR-OOC-15006090
Type 2 diabetes mellitus (T2DM) is a global complex chronic disease, which needs continuous medical intervention. Besides the control of blood glucose, it is necessary to pay attention to the continuous treatment in blood pressure and lipid profiles, in order to reduce multiple complications, which is important objective of intervention [1]. The prevalence of diabetes is rising in China, from 0.67% in 1980 to 10.4% in 2013, which is higher in cities than in rural areas [2]. Chronic complications of diabetes in China remain high, which seriously affects patients in the quality of life, economic burden and shorten the life time of patients. Diabetes and hypertension are the common cause in heart disease, cerebrovascular disease and other organ damage. Hypertension doubles the risk of all-cause mortality and stroke, triples the risk of coronary artery disease and accelerates the progression of diabetic nephropathy, retinopathy, and neuropathy [3]. It is imperative that lowering of blood pressure to treatment targets is therefore, a priority in individuals with T2DM to prevent major cardiovascular and renal events [4]. Community health service is the basic unit of urban health service system [5]. It is the main battlefield in prevention and treatment of hypertension, diabetes and its complications. Since there is still a lack of long-term reports about the effect of hypertension on prognosis in T2DM in community, our aim is to investigate whether hypertension is associated with a worse 10-year prognosis in T2DM or not in community.
Initial Study Population
Beijing Community Diabetes Research (BCDS) is a unique large-scale prospective clinical research project led by Beijing Tongren Hospital in China, and was established since 2008. In order to improve the comprehensive ability of diabetes management, the endocrinology professors from top-tier hospitals had been to clinic of community every week for training the general practitioners and the outpatient follow-up. All the patients with T2DM were intervened in accordance with the guidelines of the Prevention and treatment of T2DM in China. The patients were followed by the fixed general practitioners face-to-face. Furthermore, patients’ blood glucose and blood pressure were monitored every three months. In the present study, Zuojiazhuang community health service center in Chaoyang district of Beijing joined in BCDS project in 2008 and last for 10 years. Inclusion criteria and exclusion criteria refer to BCDS project research methods [6].
246 cases were admitted to this study. During the follow-up, 26 cases drop-off, the drop-off rate was 10.6%, and the final 220 cases complete this study. All patients were divided into two groups, DM group (n=47) was defined as diabetes without hypertension and cardiovascular disease (CVD); at the same time, the diabetes patients with hypertension was defined as DM+ HTN group (n=173). All procedures performed in studies involving human participants were in accordance with the ethical standards of the Medical Ethics Committee of Beijing Tongren Hospital and with the 1964 Helsinki declaration and its later amendments or comparable ethical standards. Informed consent was obtained from all individual participants included in the study.
Type 2 diabetes mellitus was defined according to the criteria of the World Health Organization. Patients were considered hypertensive if they reported current use of antihypertensive medications and/or had a systolic blood pressure (SBP) ≥140 mmHg and/or diastolic blood pressure (DBP) ≥90 mmHg.
Study Protocol and Clinical Evaluation
The patients’ information at baseline was collected by a trained general practitioner, including sex, age, duration of T2DM, smoking, and so on. The medical records compiled by the BCDS project team were completed.
Anthropometric evaluation including height, body weight and waist circumference, which were performed after an overnight fast. Body mass index (BMI) was calculated as weight in kilograms divided by height in meters squared. Neck circumference (NC) [7] was measured with head erect and eyes facing forward, horizontally at the upper margin of the laryngeal prominence (Adam’s apple). Blood pressure was available for all participants. The technicians had experience of at least 2,000 blood pressure measurements. The study participants were sitting for at least 5 minutes and had refrained from smoking and drinking coffee, tea, or alcohol for at least 3 hours. In addition, any exercise was not performed for the last 30 minutes before the blood pressure measurements. A standardized mercury Sphygmomanometer was used, and the cuff size was chosen according to the measured circumference of the upper arm. The average was used for analysis.
Laboratory findings
The patients in both groups were reviewed once a year, including physical examination, biochemical examination. The patients who were suspected with diabetic retinopathy were transferred to ophthalmology center of Beijing Tongren Hospital to make up six visual field photos, and were diagnosed by professional ophthalmology doctor. For biochemical examination, fasting blood glucose (FBG), serum lipid profiles [total cholesterol, low- and high-density lipoprotein cholesterols (LDL-c and HDL-c), triglycerides], uric acid and serum Creatinine were trested by Hitachi 7180 automatic analyzer. Glycated hemoglobin (HbAlc) (VARIANT high-performance liquid phase analyzer) and urinary albumin excretion rate (UAER) (DPC IMMULITE instrument) were delivered to Endocrinology Laboratory of Beijing Tongren Hospital for testing during 10 years.
According to the guidelines for the prevention and treatment of T2DM in China, the target control was defined as following: HbA1c < 7.0%; SBP < 130 mm Hg and DBP < 80 mmHg; LDL-c < 2.6mmol/L (if complicated with coronary heart disease, LDL-c < 1.8mmol/L).
End-point events are defined as events supported by clinical symptoms, imaging tests, laboratory tests, etc. During follow-up management, the endpoint events including: (1) all-cause death; (2) Cerebral vascular events included acute cerebral infarction, acute cerebral hemorrhage and transient ischemic attack (TIA); (3) Cardiovascular events (such as myocardial infarction, coronary artery bypass, coronary stenting, unstable angina pectoris); (4) Microvascular complications such as diabetic nephropathy and diabetic retinopathy; (5) Peripheral vascular events. (6) Diabetic foot, amputation, etc.
Statistical analysis
SPSS17.0 was used for statistical analysis. Graph Prism6.0 was used for drawing. The results were expressed as mean±SD or Median (Q1, Q3). The difference between groups were compared using chisquare test for proportions, and were compared with unpaired Student's t-test or Mann–Whitney U test for means. Kaplan-Merier was used to analyze the cumulative incidence of end-point events at different time points, and Cox regression analysis was used to analyze the influence of factors on the occurrence of end-point events. If P < 0.05, the difference was statistically significant.
Baseline Characteristics
At baseline in 2008, blood pressure levels were significantly higher in DM+HTN group than in DM group. There are no significant differences in other indexes, such as sex, age, duration of T2DM, smoking, blood glucose and LDL-c. Also, there was significant difference in total cholesterol between the two groups (Table 1).
Table 1: Comparison of baseline characteristics between the two groups
Characteristic |
DM |
DM+HTN |
|
|
(n=47) |
(n=173) |
t/s |
P |
Age (years) |
60.68±9.31 |
63.03±9.54 |
-1.51(t) |
0.133 |
Gender |
|
|
|
|
Male, n (%) |
20(42.55) |
76(43.93) |
0.03(χ²) |
0.866 |
Female, n (%) |
27(57.45) |
97(56.07) |
|
|
Duration of DM (years) |
3.0(1.0,9.2) |
5.7(1.0,10.2) |
1.38(Z) |
0.169 |
Smoker |
|
|
|
0.098 |
No (n, %) |
38(80.85) |
143(82.66) |
0.08(χ²) |
|
Yes (n, %) |
9(19.15) |
30(17.34) |
|
|
BMI(kg/m2) |
24.57±3.20 |
25.24±3.09 |
-1.31(t) |
0.193 |
Waist (cm) |
84.70±7.81 |
87.93±9.33 |
-2.15(t) |
0.032 |
Neck circumference (cm) |
37.53±6.12 |
36.15±5.11 |
1.57(t) |
0.119 |
Systolic BP(mmHg) |
121.13±7.39 |
132.77±12.83 |
-7.96(t) |
0.000 |
Diastolic BP(mmHg) |
74.36±6.27 |
79.13±7.64 |
-3.86(t) |
0.000 |
Fasting blood glucose (mmol/l) |
7.16±2.00 |
7.52±2.24 |
-0.99(t) |
0.325 |
Postprandial blood glucose (mmol/l) |
>9.09±2.11 |
>8.97±2.29 |
>0.31(t) |
>0.758 |
HbA1c (%) |
7.25±1.18 |
7.15±1.32 |
0.43(t) |
0.670 |
Triacylglycerol (mmol/l) |
1.86±0.96 |
1.99±1.25 |
-0.78(t) |
0.438 |
Total cholesterol (mmol/l) |
4.81±1.31 |
5.21±1.18 |
-2.01(t) |
0.046 |
HDL-cholesterol (mmol/l) |
1.53±0.71 |
1.45±0.59 |
0.77(t) |
0.443 |
LDL-cholesterol (mmol/l) |
2.99±0.90 |
2.95±0.92 |
0.27(t) |
0.787 |
Creatinine (umol/l) |
77.6 (53.0,85.0) |
76.0(63.3,90.0) |
0.99(Z) |
0.321 |
Uric acid (mmol/l) |
303.8(249.8,331.0) |
303.0(266.0,371.0) |
1.30(Z) |
0.193 |
Profile changes during the 10-year follow-up
After 10 years of multi-factorial intervention, the changes in clinical features and occurrences of endpoint events of patients are summarized as follows. At the end of the follow-up in 2018, in DM group, the results showed that the BMI and waist circumference increased slightly, while the NC decreased slightly. In DM+HTN group, BMI did not change during the follow-up, while waist circumference and NC decreased slightly, and there was no statistical difference.
The HbA1c level in DM group decreased from 7.25% to 6.86%, and the average decrease was 0.39%. The HbA1c level in the DM+HTN group decreased from 7.15% to 7.01%, with an average decrease of 0.14%. There was no significant difference in HbA1c level between DM group and DM +HTN group (Table 2).
Table 2: Comparison of clinical characteristic at baseline and at the end of follow-up
Characteristic |
DM (n=47) |
DM+HTN (n=173) |
2018 |
2018 |
t/S |
P |
2018 |
2018 |
t/s |
P |
BMI(kg/m2) |
24.57±3.20 |
25.90±4.30 |
-1.22 |
0.237 |
25.24±3.09 |
25.25±3.00 |
-0.29 |
0.770 |
Waist (cm) |
84.70±7.81 |
85.65±7.81 |
-0.92 |
0.370 |
87.93±9.33 |
86.68±10.27 |
1.73 |
0.088 |
Neck circumference (cm) |
37.53±6.12 |
35.22±2.97 |
1.16 |
0.260 |
36.15±5.11 |
35.48±3.86 |
-0.91 |
0.367 |
Systolic BP(mmHg) |
121.13±7.39 |
126.61±7.04 |
-2.07 |
0.051 |
132.77±12.83 |
124.91±6.81 |
4.94 |
<0.001 |
Diastolic BP(mmHg) |
74.36±6.27 |
74.67±6.22 |
-0.44 |
0.663 |
79.13±7.64 |
73.44±7.05 |
4.63 |
<0.001 |
Fasting blood glucose (mmol/l) |
7.16±2.00 |
6.63±1.30 |
1.36 |
0.187 |
7.52±2.24 |
7.22±1.96 |
1.12 |
0.267 |
Postprandial blood glucose (mmol/l) |
9.09±2.11 |
8.30±1.55 |
0.60 |
0.555 |
8.97±2.29 |
9.18±1.76 |
-0.71 |
0.479 |
HbA1c (%) |
7.25±1.18 |
6.86±0.93 |
1.31 |
0.202 |
7.15±1.32 |
7.01±0.96 |
0.78 |
0.435 |
Triacylglycerol (mmol/l) |
1.86±0.96 |
1.33±0.59 |
2.35 |
0.029 |
1.99±1.25 |
1.51±0.76 |
4.16 |
<0.001 |
Total cholesterol (mmol/l) |
4.81±1.31 |
4.11±1.03 |
2.31 |
0.032 |
5.21±1.18 |
4.12±1.02 |
7.40 |
<0.001 |
HDL-cholesterol (mmol/l) |
1.53±0.71 |
1.42±0.33 |
0.46 |
0.651 |
1.45±0.59 |
1.32±0.34 |
1.05 |
0.298 |
LDL-cholesterol (mmol/l) |
2.99±0.90 |
2.54±0.74 |
1.54 |
0.138 |
2.95±0.92 |
2.42±0.76 |
3.19 |
0.002 |
Creatinine (umol/l) |
77.6(53.0,85.0) |
76.0(64.5,87.0) |
18.00 |
0.484 |
76.0 (63.3,90.0) |
72.5 (63.5,81.0) |
-594.00 |
0.037 |
Uric acid (mmol/l) |
303.8 (249.8,331.0) |
293.5 (244.0,321.0) |
13.50 |
0.579 |
303.0 (266.0,371.0) |
286.0 (225.0,323.5) |
-442.50 |
0.079 |
Note: N = number of individuals. Values are expressed as mean±SD, median (Q1, Q3) or number (%).
P statistical significance of the differences between the two groups.
In DM group at baseline, the mean level of SBP and DBP were 121.1 mmHg and 74.4 mmHg. While in 2018, the mean level of SBP and DBP were 126.6 mmHg and 74.7 mmHg respectively; and there were no significant difference (P> 0.05) (Table 2). In DM+HTN group, after 10 years’ follow-up, the level of SBP and the DBP decreased 7.9 mmHg, and 5.7 mmHg respectively, and there was a significant difference when compare with the baseline (P<0.001) (Table 2). During the 10-year period, the SBP in DM group was controlled stable from 121.1 mmHg to 126.6 mmHg; while in the DM +HTN group, the SBP decreased from 2008 to 2011. The range of subsequent targets fluctuates slightly (Table 3, Figure 1).
Table 3: Changes of blood pressure during 10-year follow-up between the two groups
Time |
DM |
DM+HTN |
|
SBP(mmHg) |
DBP(mmHg) |
SBP(mmHg) |
DBP(mmHg) |
2008 |
121.1±7.4 |
74.4±6.3 |
132.8±12.8 |
79.1±7.6 |
2011 |
122.7±6.6 |
76.8±6.1 |
126.0±9.7 |
74.9±5.8 |
2013 |
122.3±7.4 |
76.0±4.6 |
124.6±10.8 |
75.6±6.7 |
2014 |
123.6±8.7 |
75.7±5.5 |
121.9±8.0 |
75.5±5.8 |
2015 |
123.6±8.7 |
75.7±5.5 |
121.9±8.0 |
75.5±5.8 |
2016 |
122.9±5.9 |
73.1±5.0 |
124.4±11.9 |
74.7±5.5 |
2017 |
124.8±5.1 |
75.9±5.1 |
125.1±6.3 |
74.3±5.5 |
2018 |
126.9±7.1 |
74.9±6.3 |
124.9±6.8 |
73.4±7.1 |
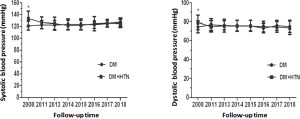
Figure 1: Changes of blood pressure during 10-year follow-up between the two groups
During the 10-year follow up, compared with baseline, the level of lipid profiles (triglyceride, total cholesterol) in DM group and DM+HTN group decreased (P < 0.05~0.01). At the end of follow-up, the LDL-c level decreased significantly in DM+HTN group (Table 2).
After intervention, cardio-cerebrovascular events (47 cases, 2.13%) occurred in DM group, and 23 cases (13.29%) of cardio-cerebrovascular events occurred in DM+HTN group, there was significant difference between the two groups (P<0.05). Other chronic diabetic complications, such as cardiovascular, cerebrovascular and microvasucular complications were the same between the two groups (Table 4).
Table 4: Comparisons of endpoint events between two groups
|
Total |
DM |
DM+HTN |
Statistic |
P |
End-point events |
(n=220) |
(n=47) |
(n=173) |
|
|
Cardiac and cerebral vascular |
|
|
|
|
|
No, n(%) |
196(89.09) |
46(97.87) |
150(86.71) |
4.74(χ²) |
0.029 |
Yes, n(%) |
24(10.91) |
1(2.13) |
23(13.29) |
|
|
Cardiovascular |
|
|
|
|
|
No, n(%) |
209(95.00) |
46(97.87) |
163(94.22) |
0.21(Fisher) |
0.464 |
Yes, n(%) |
11(5.00) |
1(2.13) |
10(5.78) |
|
|
Cerebrovascular |
|
|
|
|
|
No, n(%) |
207(94.09) |
47(100.0) |
160(92.49) |
0.04(Fisher) |
0.076 |
Yes, n(%) |
13(5.91) |
0(0.00) |
13(7.51) |
|
|
Nephropathy |
|
|
|
|
|
No, n(%) |
198(90.00) |
44(93.62) |
154(89.02) |
0.16(Fisher) |
0.425 |
Yes, n(%) |
22(10.00) |
3(6.38) |
19(10.98) |
|
|
Retinopathy |
|
|
|
|
|
No, n(%) |
206(93.64) |
44(93.62) |
162(93.64) |
0.26(Fisher) |
1.000 |
Yes, n(%) |
14(6.36) |
3(6.38) |
11(6.36) |
|
|
Compound end point events |
|
|
|
|
|
No, n(%) |
160(72.73) |
40(85.11) |
120(69.36) |
4.62(χ²) |
0.032 |
Yes, n(%) |
60(27.27) |
7(14.89) |
53(30.64) |
|
|
According to the age of ≤ 65 years or 65 years old, there were no significant differences in all the end-point events between the two groups (P>0.05) (Table 5).
Table 5: End-point events in different ages in T2DM combined with hypertension
|
<=65 years |
>65years |
Statistic |
P |
End-point events |
(n=89) |
(n=84) |
|
|
Cardiac and cerebral vascular |
|
|
|
|
No, n(%) |
77 (86.52) |
73 (86.90) |
0.01 (χ²) |
0.940 |
Yes, n(%) |
12 (13.48) |
11 (13.10) |
|
|
Cardiovascular |
|
|
|
|
No, n(%) |
82 (92.13) |
81 (96.43) |
0.13 (Fisher) |
0.331 |
Yes, n(%) |
7 (7.87) |
3 (3.57) |
|
|
Cerebrovascular |
|
|
|
|
No, n(%) |
84 (94.38) |
76 (90.48) |
0.95 (χ²) |
0.330 |
Yes, n(%) |
5 (5.62) |
8 (9.52) |
|
|
Nephropathy |
|
|
|
|
No, n(%) |
80 (89.89) |
74 (88.10) |
0.14 (χ²) |
0.706 |
Yes, n(%) |
9 (10.11) |
10 (11.90) |
|
|
Retinopathy |
|
|
|
|
No, n(%) |
83 (93.26) |
79 (94.05) |
0.05 (χ²) |
0.832 |
Yes, n(%) |
6 (6.74) |
5 (5.95) |
|
|
Compound end point events |
|
|
|
|
No, n(%) |
62 (69.66) |
58 (69.05) |
0.01 (χ²) |
0.930 |
Yes, n(%) |
27 (30.34) |
26 (30.95) |
|
|
Adjusted for multivariate, in Cox multivariate analysis, hypertension had important effect on cardio-cerebrovascular endpoint events risk (HR : 7.63 , 95%CI : 1.04−6.22) (Table 6). The Kaplan-Merier curves of cardio-cerebrovascular events and compound endpoint events in the two groups showed significant differences between the two groups (P<0.01) (Figure 2).
Table 6: Cox regression analysis of the impact of hypertension on endpoint events
End-point events |
b |
stb |
Wald |
P |
HR |
95%CI for HR |
Lower |
Upper |
Cardiac and cerebral vascular |
2.03 |
1.02 |
3.98 |
0.046 |
7.63 |
1.04 |
6.22 |
Cardiovascular |
1.05 |
1.05 |
1.00 |
0.317 |
2.86 |
0.37 |
2.33 |
Cerebrovascular |
1.34 |
1.04 |
1.67 |
0.196 |
3.83 |
0.50 |
9.26 |
Nephropathy |
0.66 |
0.62 |
1.14 |
0.286 |
1.94 |
0.57 |
6.56 |
Retinopathy |
0.06 |
0.65 |
0.01 |
0.921 |
1.07 |
0.30 |
3.83 |
Compound end point events |
0.81 |
0.40 |
4.04 |
0.045 |
2.24 |
1.02 |
4.94 |
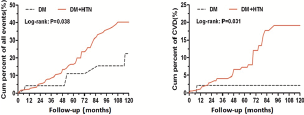
Figure 2: Survival curve of patients between the two groups
At present, the prevalence of T2DM in the world is severe [8], and the prevalence of T2DM in China is the first in the world. It is closely related to the rapid urbanization, aging, increasing prevalence of overweight and obesity, and the genetic susceptibility of Chinese people [2].
The task of prevention and treatment of chronic diseases such as diabetes and hypertension was important work direction in diabetes management the community [9]. Recently, there is still a lack of long-term reports on T2DM in community. Due to the occurrence of complications and the accumulation of time, it is difficult to expose the whole process in a short period of time. The BCDS study, which is first to assess whether multi-factorial interventions have a long-term effect on the risk of diabetes-related macrovascular complications T2DM in China, was led by Beijing Tongren Hospital and launched in 2008. Zuojiazhuang community was the first to join this project in 2008 and last for 10 years. All important laboratory tests of patients were centralized.
Many occurrences of multimorbidity with CVD had been recognized and investigated in previous studies, and hypertension was one of the most widely studied occurrences of multimorbidity with CVD [10]. In 2007, 34% of diabetic patients complicated with hypertension were reported in China. A survey of 36 hospitals in Beijing showed that the rate of diabetic in patients with hypertension was 60.8% [11]. Diabetes combined with hypertension increases the risk of cardiovascular events and deaths. In the BCDS project, there were 70% of T2DM patients with hypertension [12]. In the present study, compared with simple DM group, blood pressure levels in patients with T2DM combined hypertension decreased significantly, while cardio-cerebrovascular and compound end-point events are still significantly higher than that of DM group. The effects on vascular endothelial cells caused by diabetes and hypertension might be the reason. Once The occurrence of the damage in large vessels and micro-vascular is superimposed, the occurrence of cardio-cerebrovascular complications increase double. Because the number of cases is small, this result might show some light on prevention of diabetic complications in the community.
Moreover, some studies also showed that the pattern of multimorbidity of CVD was different among groups stratified by sex and age [13, 14]. And the prevalence of multimorbidity was the highest in the middle-age, while the prevalence of multimorbidity with CVD was the highest in the old population [15]. In the present study, after 10-year intervention, the results showed that the patients of T2DM less than 65 years old had 12 cases (13.5%) of cardio-cerebrovascular events, while there were 11 cases (13.1%) of cardiovascular and cerebral vascular events occurred in T2DM over 65 years old. There was no significant difference between the two groups.
Patients with hyperlipidaemia are mostly asymptomatic; however, these patients have an increased risk for cardiovascular disease (CVD), which is the main cause of premature death, and has been a major cause of disability and ill health in recent years [16]. In a cross-sectional survey conducted in Asia [17], >70 % of patients with diabetes, CHD, carotid artery disease, peripheral arterial disease, metabolic syndrome, or other multiple risk factors (10-year CHD risk >20 %) did not achieve the recommended LDL-c targets. After 10-year intervention, patients with hypertension decreased their total cholesterol level from 5.21mmol/L to 4.12mmol/L (P<0.001) and triglyceride level from 1.99mmol/L to 1.51mmol/L (P<0.001), while LDL-c decreased significantly from 2.95mmol/L to 2.42mmol/L (P < 0.001) (Table 2).
The rising prevalence of chronic diseases such as type 2 diabetes mellitus (T2DM), cardiovascular disease (CVD), and hypertension has been recognized as a public health problem affecting both developed and developing countries [18, 19]. In Cox multivariate analyses, hypertension had important effect on cardio-cerebrovascular endpoint events risk (HR:7.63,95%CI:1.04−6.22). Since the number of cases is still small, more cases need to be confirmed.
The Kaplan-Merier curve of cardio-cerebrovascular events in two groups shows that the accumulation rate of cardio-cerebrovascular events in the past 10 years is significantly different from 72 months. The longer the intervention time is, the greater the difference between the two groups will do. The cardio-cerebrovascular events in the patients with hypertension were 7.63 times higher than those in the DM group (P<0.05) (Table 5, Figure 2). Unfortunately, it was not possible to set a group of non-intervention DM+HTN follow-up for 10 years as a control. However, it is suggested that the prognosis of diabetic patients with hypertension deserves more attention. How to reduce the complications needs to be further studied.
Our study suggests that the incidence of the cardio-cerebrovascular events in T2DM with hypertension is 7.63 times higher than that of simple T2DM. Hypertension is associated with a worse 10-year prognosis in T2DM.
Limitations
Several limitations of the study design should be noted. Although we have adjusted potential confounding, there may be other measured and unmeasured factors which we were not able to detect or obtain. Since the number of cases is still small, more cases need to be confirmed.
Abbreviations
Type 2 diabetes mellitus (T2DM)
Beijing Community Diabetes Research (BCDS) Cardiovascular disease (CVD)
Systolic blood pressure (SBP) Diastolic blood pressure (DBP) Fasting blood glucose (FBG)
Low density lipoprotein cholesterols (LDL-c) Glycosylated hemoglobin (HbAlc)
Transient ischemic attack (TIA) Body mass index (BMI)
Neck circumference (NC)
Declarations
Ethics approval and consent to participate
The study was approved by the Medical Ethics Committee of Beijing Tongren Hospital and all participants provided written informed consent.
All procedures performed in studies involving human participants were in accordance with the ethical standards of the Medical Ethics Committee of Beijing Tongren Hospital and with the 1964 Helsinki declaration and its later amendments or comparable ethical standards. Informed consent was obtained from all individual participants included in the study.
Consent to publish
Not applicable.
Availability of data and materials
Researchers are allowed to verify the results of the article, copy the analysis, and perform secondary analysis.
Competing interests
The authors declare that there is no conflict of interest regarding the publication of this paper.
This project is supported by a Capital Medical Development Foundation of China (2007-1035), a Grant of Special Scientific Research on Capital Health Development (2011-2005-01, 2016-1-2057, 2016-2-2054), Beijing Municipal Science &Technology Commission (Z151100004015021), BRIDGES Grant from the International Diabetes Federation (ST12-024).
Authors' Contributions
Professor Shen-yuan Yuan was for the study conception and design.
Professor Xue-Lian Zhang drafted the manuscript, and contributed to the collection and standardization of the data.
Dr. Dongming Hu contributed to the collection and standardization of the data.
Professor Wan Gang conducted the principal statistical analysis, data analysis and interpretation. All authors contributed to the writing of this paper and approved the final version.
We thank the participants and general practitioners who took part in the study.
- China Society of Diabetes (2018) China Guideline for Type 2 Diabetes. Chinese Journal of Diabetes Mellitus 10: 4-67.
- Xu Y, Wang L, He J, et al. (2013) Prevalence and control of diabetes in Chinese adults JAMA 310: 948-959. [Crossref]
- Sowers JR, Epstein M, Frohlich ED (2001) Diabetes, hypertension, and cardiovascular disease an update. Hypertension 37: 1053-1059. [Crossref]
- Lopez-Jaramillo P, Lopez-Lopez J, Lopez-Lopez C, et al.(2014) The goal of blood pressure in the hypertensive patient with diabetes is defined: now the challenge is go from recommendations to practice. Diabetol Metab Syndr 6: 31. [Crossref]
- Fu HJ (2015) General practitioners should actively strengthen primary prevention of diabetes mellitus. Chinese Journal of General Practitioners 14: 897-900.
- Zhuang N, Zhang JD, Wan G, et al. (2017) An eight-year cohort study of the effect of the joint control on cardiovascular events and all-cause mortality with type 2 diabetes mellitus. Chinese General Practice 20: 3109-3l16.
- Yang GR, Yuan SY, Fu HJ, et al. (2010) Neck circumference positively related with central obesity, overweight and metabolic syndrome in Chinese people with type 2 diabetes: Beijing Community Diabetes Study 4. Diabetes Care 33: 2465-2467. [Crossref]
- Chen L, Magliano DJ, Zimmet PZ (2011) The worldwide epidemiology of type 2 diabetes mellitus—present and future perspectives. Nat Rev Endocrinol 8: 228-236. [Crossref]
- Chen R, Ji L, Chen L, et al. (2015) Glycemic control rate of T2DM out-patients in China: a multi-center survey. Med Sci Monit 21: 1440-1446. [Crossref]
- Unal S, Acar B, Ertem AG, et al. (2017) Endocan in Hypertension and Cardiovascular Diseases. Angiology 68: 85. [Crossref]
- Chi JM, Wu Q, Qin MZ, et al. (2008) The investigation of treatment target for 2077 patients with type 2 diabetes mellitus in Beijing. Beijing Medical Journal 8: 513-515.
- Qin MZ, Yuan SY, Fu HJ, et al. (2013) Prevalence of hypertension and blood pressure control rate in patients with type 2 diabetes mellitus in Beijing communities. Chinese Journal of General Practitioners 12: 537-540.
- Khalil Murad, David C Goff Jr, Timothy M Morgan, et al. (2015) Burden of Comorbidities and Functional and Cognitive Impairments in Elderly Patients at the Initial Diagnosis of Heart Failure and Their Impact on Total Mortality: The Cardiovascular Health Study. JACC Heart Fail 3: 542-550. [Crossref]
- Tang Z, Wang CX, Song XW, et al. (2013) Co-occurrence of cardiometabolic diseases and frailty in older Chinese adults in the Beijing Longitudinal Study of Ageing. Age Ageing 42: 346-351. [Crossref]
- Jin LN, Guo X, Dou J, et al. (2018) Multimorbidity Analysis According to Sex and Age towards Cardiovascular Diseases of Adults in Northeast China. Sci Rep 8: 8607.
- Ades PA (2014) A controversial step forward: A commentary on the 2013 ACC/AHA guideline on the treatment of blood cholesterol to reduce atherosclerotic cardiovascular risk in adults. Coron Artery Dis 25: 360-363. [Crossref]
- Munawar M, Hartono B, Rifqi S (2013) LDL cholesterol goal attainment in hypercholesterolemia: CEPHEUS Indonesian survey. Acta Cardiologica Sinica 29: 71-81. [Crossref]
- Yach D, Hawkes C, Gould C, et al. (2004) The global burden of chronic diseases: overcoming impediments to prevention and control. JAMA 291: 2616-2622. [Crossref]
- Miranda-Machado P, Salcedo-Mejía F, Wilches JP, et al. (2019) First cardiovascular event in patients with type 2 diabetes mellitus of a cardiovascular risk management program of a poor Colombian population: a cohort study. BMC Cardiovasc Disord 19: 8. [Crossref]