This paper describes the author’s application of Spatial Analysis and Forecasting to manage Type 2 Diabetes (T2D) conditions.
The author utilizes the GH-Method: math-physical medicine to manage metabolic disorder diseases especially diabetes. Initially, he observed various disease phenomena. Therefore, he recorded big volume of related data, derived necessary and applicable mathematical equations, utilized suitable computational tools, including time-series analysis, spatial analysis, frequency domain analysis, and artificial intelligence. As a result, he combined them with the medical domain knowledge in order to forecast the forthcoming outcomes to interpret new findings or discoveries regarding human health.
In this paper, he disregards the theoretical discussion of spatial analysis in order to focus on application and certain results from his diabetes research by using spatial analysis and forecasting method.
Here are some of the results from spatial analysis and forecasting:
1. Weight: The orientation of data cloud with predicted and measured weight values are skewed from lower right toward upper left. The values of predicted weight and actual weight are very close to each other and move together simultaneously. This reflects high accuracy and correlation between these two variables.
2. Fasting Plasma Glucose (FPG) in Early Morning: The orientation of data band of FPG vs. Weight is also from lower left toward upper right. This means that they are closely related and weight is the major formation factor of FPG.
3. Postprandial Plasma Glucose (PPG) at Two Hours after Fist-Bite of Meal: The orientation of data band of carbs/sugar vs. PPG is from lower left toward upper right (positive) which means more carbs/sugar creates higher PPG. However, the orientation of data band of post-meal walking vs. PPG is from upper left toward lower right (negative) which means more walking steps brings down PPG.
4. Hemoglobin A1C or HbA1C (A1C): The medical community uses A1C as the measuring yardstick to determine the severity of the patients’ diabetes conditions. There are no consistent conversion ratios available between glucose and A1C. Therefore, the author applied statistics tools (including time-series analysis, spatial analysis, and frequency-domain analysis) and engineering approximation modeling to build an effective A1C forecasting model. Using spatial analysis to compare predicted A1C and lab-tested A1C (quarterly data due to insurance constraints); he noticed that spatial analysis tool is not as effective as time-series analysis tool due to limited lab-tested A1C (only 23 data). One limitation about spatial analysis is the requirement of a larger size of data in order to see the trend of data change.
By using spatial analysis method, this clinical case study of more than four years, encompassing 1,488 days and ~500,000 big data, has demonstrated its powerful forecasting capability on weight, glucose, and diabetes control.
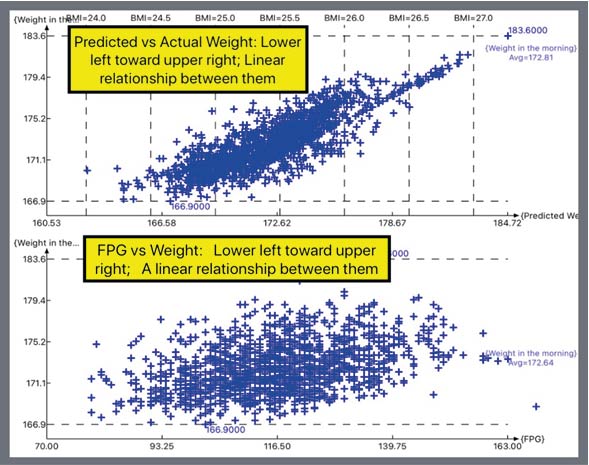
Figure 1. Weight and FPG
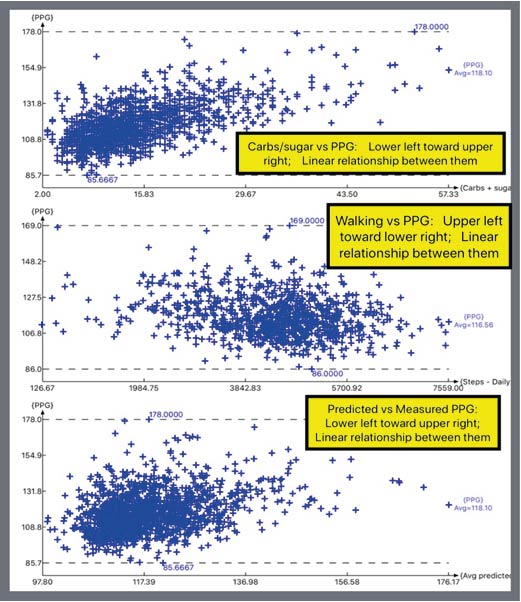
Figure 2. Carbs/sugar (+R) and Walking (-R) vs. PPG
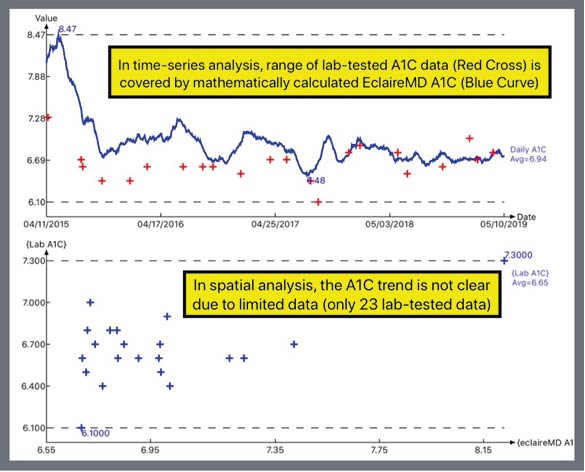
Figure 3. HbA1C
- Molecular Cell Biology. 4th Edition. Section 6.3 Viruses: Structure, Function, and Uses. [Crossref]
- Ehsan Kamani (2019) Dev Nitin Patel, Zahra Kamani and Ali kakouei, Medical Lasers. J Ophthalmol Clin Res. [Crossref]
- Intravenous Laser Blood Irradiation Therapy. [Crossref]
- Fatma Vatansever, Cleber Ferraresi, Marcelo Victor Pires de Sousa, et al. (2013) Can biowarfare agents be defeated with light? Virulence. Landes Bioscience 4: 1-30. [Crossref]
- Diem Tho Ho, Ahran Kim, Nameun Kim, et al. (2020) Effect of blue light emitting diode on viral hemorrhagic septicemia in olive flounder (Paralichthys olivaceus). Aquaculture 521: 735019. [Crossref]
- Fatemeh Mirzaei1, Mozafar Khazaei, (2017) Role of Nitric Oxide in Biological Systems: A Systematic ReviewJ MazandaranUniv Med Sci 27: 192-222. [Crossref]
- Cuzzocrea S, Mazzon E, Calabro G, et al. (2000) Inducible nitric oxide synthase-knockout mice exhibit resistance to pleurisy and lung injury caused by carrageenan. Am J Respir Crit Care Med 162: 1859-1866. [Crossref]
- Nisoli E, Carruba MO, (2006) Nitric oxide and mitochondrial biogenesis. J Cell Sci 119: 2855-2862. [Crossref]
- Mittermayr (2007) Ludwig Boltzmann Institute Wien in Zusammenarbeit mit der Russian State Medical University in Moskau Mol Med 13: 22-29. [Crossref]
- Timon Cheng Yi Liu, Rui Duan, Pei Jun Yin, et al. (2000) Rui Duan embrane mechanism of low-intensity laser biostimulation on a cell October 2000. Proceedings of SPIE-The International Society for Optical Engineering. [Crossref]
- KN Prodouz, JC Fratantoni, EJ Boone, et al. (1987) Use of laser-UV for inactivation of virus in blood products. Blood 70: 589-592. [Crossref]