Objective: To clarify the long-term cumulative survival rate (CSR) and standardized mortality ratio (SMR) of rheumatoid arthritis (RA) and osteoarthritis (OA) patients who underwent total knee arthroplasty (TKA).
Method: Data for 325 RA and OA patients with 460 primary TKAs from 1997 to 2007 were reviewed. We divided the patients into ≤70 years (u70) and ≥71 years (o71) groups. The follow-up duration in the RA group (n=118) was 12.8±4.8 years vs 13.0±4.1 years in the OA group (n=207).
Results: The SMR of the female RA patients was 1.97 (95%CI 0.96-3.89) after 5 years and 4.59 (95%CI 3.44-6.10) after 20 years. The SMR in female OA patients was 0.41 (95%CI 0.17-0.93) after 5 years and 1.31 (95%CI 0.996-1.73) after 20 years.
The 20-year CSR of female RA-o71 patients was lowest with 9.6 (95%CI 0-26). There was no significant difference in CSR between the RA-u70 and OA-o71 groups. The CSR in the OA-u70 group was highest with 77.8 (95%CI 0.62-0.93). Cox proportional hazards model analysis of female patients showed that steroid-use [Hazard ratio (HR) 3.22, 95%CI 1.32-13.46], age (HR 1.09, 95%CI 1.05- 1.30), and rheumatoid factor (HR 1.002, 95%CI 1.00-1.01) were risk factors in the RA-u70 group.
In the RA-o71 group, steroid use (HR 4.71, 95%CI 1.35-16.7), age (HR 1.38, 95%CI 1.12-1.71) and C-reactive protein (HR 1.20, 95%CI 1.02-1.41) were risk factors, whereas in the OA group, only age at surgery (HR 1.10, 95%CI 1.033-1.163) was a risk factor.
Conclusion: SMR of female patients was high in RA and low after 5 years in OA. RA-u70 patients had the similar cumulative sur- vival curve as OA-o71. The CSR of RA-o71 patients was poor. The preoperative factors affecting survival differed between u-70 and o-71 in RA.
CI: Confidence Interval; CR: Cruciate Retention; CRP: C Reactive Protein; CSR: Cumulative Survival Rate; FTA: Femorotibial Angle; JOA: Japanese Orthopaedic Association; MTX: Methotrexate; OA: Osteoarthritis; o71: Over 71 years old; Pts: Patients;RA: Rheumatoid Arthritis; RF: Rheumatoid Factor; ROM: Range of Motion; SMR: Standardized Mortality Rate; TKA: Total knee arthroplasty; u70: Under 70 years old;y: year
Introduction
Knee joints destroyed by osteoarthritis (OA) or rheumatoid arthritis (RA) are reconstructed with total knee arthroplasty (TKA). TKA is an established surgical procedure that can re- lieve knee pain, enhance knee function, and improve the pa- tient quality of life.
The global life expectancy is increasing [1] and the number of older people undergo TKA has also increased; TKAs are now performed in a wide range of age groups. For physicians and patients, it is very important to have information regarding on knee function after TKA as well as survival data in patients with RA and OA who have undergone TKA. Previous studies comparing survival rates after TKA in patients with RA and OA reported a low survival rate with RA [2-5]. On the con- trary, the reported survival rate after TKA in patients with OA was high [6-9], approximately the same [10, 11], or low- er [12, 13] compared with that in the general population. However, there are no reports comparing the survival rate after TKA in elderly patients with RA and OA.
The purpose of this study was to clarify the long-term cumu- lative survival rate (CSR) and the standardized mortality ra- tio (SMR) of patients with OA and RA who underwent TKA, and to evaluate survival rates after TKA in elderly patients.
Methods and Patients
In this retrospective study, data for 328 consecutive patients with RA and OA with 460 primary TKAs from 22 August 1997 to 17 December 2007 were reviewed. All surgeries were performed by a single surgeon in a hospital under gen- eral anesthesia, and all patients were medically treated by a single physician. The study period was when methotrex- ate and biologics were introduced as RA drug therapies in Japan.
The patients were followed until 30 August 2018 or until death. We evaluated 118 patients (169 joints) with RA and 207 patients (286 joints) with OA. We excluded 3 patients with OA (5 joints) because these patients changed to anoth- er clinic and could not be contacted within 1 year after TKA. All RA patients fulfilled the 1987 revised American College of Rheumatology criteria for RA [14]. OA patients were as- sessed as grade 3 or 4 by the Kellgren–Laurence classifica- tion of the knee [15].
As the mean age at surgery for all 325 patients was 69.6 (SD 8.7) years, we divided the patients into two groups: ≤ 70 years (u70) and ≥ 71 years old (o71) [9].
Evaluation Methods
The influence on the survival rate at the time of age of oper- ation, preoperative height, weight, body mass index (BMI), Japanese Orthopaedic Association (JOA) knee score [16], bi- lateral replacement, knee joint range of motion (ROM), and femorotibial angle (FTA) on standing radiographs was in- vestigated and compared between the RA group and the OA group, and between subgroups u70 and o71. The effect of preoperative serum C-reactive protein (CRP) concentration, tender joint counts, swollen joint count, rheumatoid factor (RF), and the use of methotrexate (MTX), corticosteroids, and/or biologic agents just before TKA on the survival rate was investigated in the patients with RA.
Forty-three patients with RA and 75 patients with OA were evaluated by direct examination. We also conducted tele- phone surveys and a letter survey to determine the live sta- tus of 21 patients with RA and 65 patients with OA who had stopped visiting our clinic. Fifty-four patients with RA and 67 patients with OA had died at the end of the study period, and in these patients, two medical clerks contacted the pa- tients’ families to determine the date and cause of death.
Implants and Operations
The prosthesis used in all patients was the Genesis 2 (Smith & Nephew, Memphis, TN, USA) [17], which was introduced
into our country in August 1997. The TKA prostheses were the cruciate-retaining type in 147 implants (85.8%) in pa- tients with RA and in 240 implants (71.3%) in OA patients; the posterior-stabilized type in 22 implants with RA and in 46 implants with OA; and the revision type in 1 implant with RA. The patella was replaced with an inset convex patella in all but three knees of two patients with RA.
All TKAs were performed by one surgeon at one institution, and postoperative follow-up and RA medical treatment were performed by the same surgeon, since he is also a board-cer- tified rheumatologist approved by Japanese Rheumatology Association.
Statistical Analysis
The CSR was estimated using the Kaplan–Meier method. Preoperative variables were compared between living and dead patients in each of the four subgroups using the Cox proportional hazard model. As appropriate, statistical ana- lyzes were performed using univariate and multivariate regression models, Student’s t test, the Chi-square test, and one-way ANOVA followed by Bonferroni post hoc. For all statistical analyses, p<0.05 was considered to indicate sig- nificance. Details of the results of the statistical analysis are given in the supplementary data.
The expected mortality rate was calculated from the age- and sex-specific Japanese population rates from 1977 to 2007 [18]. SMR was calculated by dividing the observed number of deaths by the expected number of deaths. Results are expressed as SMR with the associated 95% confidence interval. All statistical analyzes were performed with the Bell curve for Excel (version 3.20) (Social Survey Research Information).
Results
Overall Outcome
The mean age at surgery for the 118 patients in the RA group was 64.6 (10.3) years, and the mean age for the 207 patients in the OA group was 72.9 (5.8) years. Table 1 and Supple- mentary Table S1 show the variable data for the RA and OA groups, each divided into u70 and o71 subgroups. With the reference to report of Hunt et al [9], we divided the patients into two age groups. Females accounted for more than 80% of the patients in all the four groups. The mean age at surgery of the RA-u70 group (58.9 years) was significantly younger than the age of the other three groups. The mean ages of the RA-o71 and OA-o71 groups were 74.6 years and 76.2 years, respectively. The mean age at the incidence of RA for the fe- male u70 group was 43.1 (12.6) and 60.8 (8.7) years for the female o71 group (Table 1 and supplementary Table S1).
Body weight and BMI were higher in the OA group. The num- ber of patients with bilateral TKA in the RA-u70 group was significantly higher than in the OA-u70 group. The range of motion was worse in the RA-u70 group than in the OA group, and the JOA score in the RA-o71 group was higher than in the RA-u70 and OA-o71 groups. The FTA was larger in the OA group than in the RA group.
Table 1. Variable of RA-u70, RA-o71, OA-u70 and OA-o71 groups
RA-u70
RA-o71
OA-u70
OA-o71
patients (joints)
75 (111)
43 (58)
67 (83)
140(203)
female (%)
66 (88.0)
40 (93.0)
56 (82.8)
131 (92.9)
age at operation (y)
58.9±8.5
74.6±2.7
66.5±3.8
76.2±3.7
height
155.4±7.4
150.5±7.4
154.7±8.0
151.2±6.7
body weight
51.0±9.7
47.9±7.7
62.2±10.7
56.3±8.9
BMI
21.1±3.4
21.1±2.6
25.9±3.6
24.6±3.2
bilateral TKA (pts)
38 (50.7%)
13 (30.2%)
21 (31.3%)
61 (43.6%)
CR type
93 (83.8%)
54 (93.1)
68 (82.0%)
172 (84.7%)
ROM
90.2±31.7
98.5±25.1
103.6±18.1
106.3±18.1
JOA total score
46.2±13.1
51.9±8.9
48.5±11.2
47.5±10.0
FTA
174.9±8.0
177.6±6.9
186.5±6.4
186.3±6.8
follow-up period (y)
14.0±4.5
10.8±4.5
14.7±4.1
12.1±3.9
Death patients (female)
27 (25)
27 (25)
17 (11)
50 (46)
age at death
71.8±7.2
84.4±5.6
79.9±5.3
87.1±5.8
CR: cruciate retention, FTA; femorotibial angle, JOA; Japanese Orthopaedic Association, OA; Osteoarthritis, o71; over 71 years old, pts; pa- tients, RA; rheumatoid arthritis, ROM; range of motion, TKA; total knee arthroplasty, u70; under 70 years old, y; year.
The duration of follow-up in the RA group was 12.8 (4.8) years and 13.0 (4.1) years in the OA group (p =0.7195). The RA- and OA-u70 groups had longer follow-up durations than the RA- and OA-o71 groups.
The TKA Revision was performed in 4 joints (2.4%) in the RA group and 7 joints (2.4%) in the OA group. The causes of revision constituted two mechanical loosening, one late infection, and one fracture in the RA group, and three late infections, two fractures, one dislocation, and pain in the OA group. The 21-year CSR after TKA was 97.0% for both the RA and OA groups. CSR were 97.7%, 96.2%, 95.8%, and 97.9% in the RA-u70, RA-o71, OA-u70, and OA-o71 groups, respectively (log-rank test: p= 0.7718).
Age and Cause of Death
During follow-up, 54 (45.8%) of the 118 patients in the RA group and 67 (32.4%) of the 207 patients in the OA group died. In particular, 27 (62.8%) patients in the RA-o71 group died, which was the highest rate in the four groups (Table 1 and supplementary data).
The mean age at death was 78.1 (9.0) years in the RA group and 85.3 (6.5) years in the OA group (p <0.001). When com- paring the mean age at death of female patients in the four groups, the RA-u70 group was younger than the other three groups; the mean age at death in the RA-o71 group was not different from that in the OA groups (Table 1). The period from surgery to death of female patients is RA-u70 group 9.8 (4.2), RA-o71 group 9.5 (4.6), OA-u70 group 11.1 (5.8) and OA-o71 group 10.2 (3.7) years.
The causes of death were respiratory diseases (n=5) and infectious diseases (n=4) in the RA-u70 group, and respira tory diseases (n=6), senile dementia (n=7), and malignant tumors (n=5) in the RA-o71 group. Malignant tumors (n=8) were common in the OA-u70 group, and cardiovascular dis- ease (n=15), senile dementia (n=11), and malignant tumors (n=9) were causes in the OA-o71 group. Other deaths due to renal dysfunction (n=3) and multiple organ failure (n=2) were observed in the RA-u70 group, but not in the RA-o71 and OA groups.
The mortality rate in the RA group was 35.7 per 1000 per- son-years (95% CI: 26.2–45.2) and 25.2 per 1000 person- years (95% CI: 19.2–31.2) in the OA group. When comparing mortality rates in the four groups, the highest mortality rate occurred in the RA-o71 group at 58.2 per 1000 person-years (95% CI: 26.9–89.5). The rate in the RA-u70 group was 25.7 per 1000 person-years (95% CI: 11.9–39.6); OA-u70: 17.2 per 1000 person-years (95% CI: 9.0–25.4) and OA-o71: 29.8 per 1000 person-years (95% CI: 21.6–37.9).
Only two patients died within 1 year after TKA. None of the patients died from TKA surgery-related complications.
Comparison of the SMRs
The age- and sex-specific SMR of patients after the primary TKA was calculated according to the Japanese demographics for 1997 to 2015 (Table 2) (18). In female patients, the SMR of the RA group was as high as 1.97 after 5 years, 3.49 after 10 years and 4.59 after 20 years (Table 2). The SMR of the female OA group was 0.41 after 5 years, which was lower than that of the general population, and 1.15 after 15 years and 1.31 after 20 years.
Table 2. Standardized mortality rates every 5 years for each sex and each group
Although a small number of male patients were analyzed, the SMR after 5 years was 0.92 for the RA group and 0.71 for the OA groups. Twenty years after TKA, the SMR for male RA patients was 1.42 and that for male OA patients was 2.03.
Comparison of the CSRs
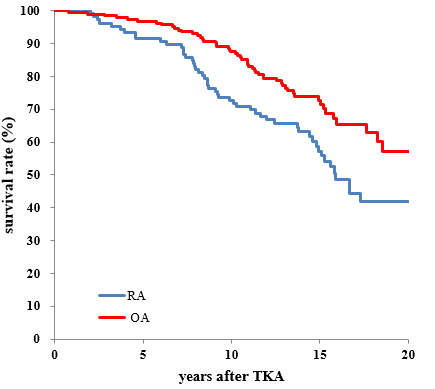
Figure 1 shows the CSRs of female patients with RA and OA up to 20 years after surgery. Table 3 and supplementary data Table S2 compare the CSR every 5 years up to 20 years. The OA group had a higher survival rate than the RA group over the course of follow-up, and the CSR after 20 years was 41.9% in the RA group and 57.0% in the OA group (Fig.1 and Table 3).
Figure 1. Cumulative survival curve of female patients with rheumatoid arthritis and osteoarthritis.
OA: osteoarthritis, RA: rheumatoid arthritis, log-rank test 0.005
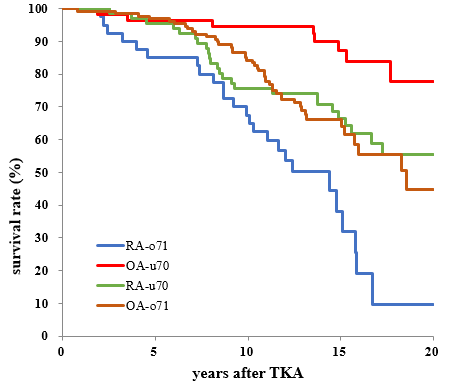
Figure 2. Cumulative survival curves of female patients with RA and OA divided into the u70 and o71 groups
OA: osteoarthritis, RA; rheumatoid arthritis, u70; under 70 years old, o71; over 71 years old
Table 3. Cumulative survival rates every 5 years of female patients with RA and OA, and subdividing groups were estimated by the Kaplan-Meire method.
Age at TKA
5yrs (95%CI)
10yrs (95%CI)
15yrs (95%CI)
20yrs (95%CI)
RA (n=106)
64.7±10.4
91.5 (86-96)
74.6 (66-82)
57.3 (47-67)
41.9 (30-54)
OA (n=187)
73.0±5.8
96.8 (94-97)
87.4 (83-92)
72.6 (66-80)
57.0 (45-69)
RA-u70
58.7±8.8
95.5 (90-100)
75.8 (65-86)
66.5 (54-78)
55.5 (41-70)
RA-o71
74.5±2.6
85.0 (74-96)
67.5 (52-82)
38.2 (19-57)
9.6 (0-26)
OA-u70
66.3±4.0
96.4 (92-100)
94.6 (89-100)
87.1 (77-97)
77.8 (62-93)
OA-o71
75.9±3.7
97.0 (94-100)
84.2 (78-91)
66.3 (57-75)
44.8 (28-61)
The CSRs of female patients with RA and OA divided into the u70 and o71 groups are shown in Figure 2, Table 3 and Supple- mentary Table S2. The OA-u70 group had the highest survival rate of the four groups, and the RA-o71 group had the lowest. There was no significant difference in CSR between RA-u70 and OA-o71 over the course of the follow-up.
The CSR of female RA group was lower than that of the female OA group. The 5-year survival rates of the RA-u70, OA-u70, and OA-o71 groups were ≥ 90%, with no significant differences between the groups. The survival rate of the OA-o71 group was lower than that of the OA-u70 group 15 and 20 years after TKA [19-21].
Risk Factors for Mortality
The preoperative factors that affect mortality were investigated using the Cox proportional hazards model. In the RA group,
age at TKA, RF titer, and steroid use were risk factors for mortality. CRP, MTX, and biologic-use were not influential factors.
When the hazard risk ratio was analyzed by dividing female patients with RA into u70 and o71 groups, in u70 group, age, RF titer and steroid-use were risk factors (Table 4). However, in the o71 group, age, steroid-use, and CRP were risk factors, and RF titer was not (Table 5).
Table 4. Analysis of preoperative clinical data of female RA patients under 70 years by Cox Proportional Hazard Model
pre-operative variable data
41 survivals (M±SD)
25 deaths (M±SD)
Hazard ratio
95% CI
P value
age at operation
56.6±9.3
62.2±6.7
1.093
1.05-1.30
0.004
height (cm)
154.5±6.1
152.8±6.9
1.022
0.97-1.15
0.223
body weight (kg)
52.5±9.5
45.8±8.1
0.983
0.90-1.02
0.196
unilateral:1, bilateral:2
1.5±0.5
1.6±0.5
0.631
0.49-3.76
0.559
ROM (degree)
83.7±37.1
97.4±24.1
1.010
0.99-1.02
0.922
JOA total score
46.6±13.8
44.0±12.0
0.999
0.96-1.03
0.885
FTA
174.3±7.6
175.4±9.0
1.007
0.95-1.10
0.594
rheumatoid factor (IU/mL)
114.0±122.1
279.4±267.2
1.002
1.00-1.01
< 0.001
MTX-use (0:no, 1: use)
0.7±0.5
0.5±0.5
0.601
0.32-1.94
0.609
steroid-use (0:no, 1: use)
0.5±0.5
0.8±0.4
3.221
1.32-13.46
0.015
Biologic-use (0:no, 1: use)
0.17±0.38
0.0
unable to evaluate
CRP (mg/dL)
3.4±3.5
4.3±3.8
1.070
0.92-1.21
0.463
tender joint count
6.3±7.9
7.6±8.1
1.039
0.88-1.04
0.294
swollen joint count
11.0±8.5
12.4±8.9
0.961
0.94-1.11
0.684
CRP; C reactive protein, FTA; femorotibial angle, JOA; Japanese orthopaedic association, MTX; methotrexate, OA; Osteoarthritis, RA; rheumatoid arthritis, ROM; range of motion
Table 5. Analysis of preoperative clinical data of female RA patients over 71 years by Cox Proportional Hazard Model
pre-operative variable data
15 survivals (M±SD)
25 deaths (M±SD)
Hazard ratio
95% CI
P value
age at operation
73.5±2.3
75.0±2.6
1.3845
1.12-1.71
0.002
height (cm)
151.7±5.8
148.0±6.5
0.9149
0.79-1.05
0.219
body weight (kg)
50.1±8.1
45.5±7.0
1.0263
0.91-1.16
0.676
Unilateral:1, bilateral:2
1.3±0.5
1.3±0.5
0.3220
0.09-1.12
0.075
ROM (degree)
98.3±27.2
97.0±24.9
1.0099
0.99-1.03
0.385
JOA total score
52.1±11.4
50.6±6.1
1.0596
0.98-1.15
0.168
FTA
179.7±6.7
175.7±6.8
0.9895
0.92-1.07
0.787
rheumatoid factor (IU/mL)
144.7±169.6
171.2±149.8
1.0029
0.99-1.01
0.173
MTX-use (0:no, 1: use)
0.5±0.5
0.4±0.5
0.4770
0.16-1.45
0.192
steroid-use (0:no, 1: use)
0.3±0.5
0.4±0.5
4.7435
1.35-16.7
0.015
biologic-use (0:no, 1: use)
0.1±0.3
0.04±0.2
2.7068
0.28-26.34
0.391
CRP (mg/dL)
2.8±3.1
4.5±3.1
1.1988
1.02-1.41
0.032
tender joint count
4.7±4.2
4.8±3.0
1.2462
0.98-1.59
0.077
swollen joint count
9.8±7.4
7.7±4.4
0.8542
0.73-1.00
0.053
CRP; C reactive protein, FTA; femorotibial angle, JOA; Japanese Orthopaedic Association, MTX; methotrexate, ROM; range of motion
In the female OA group, age at surgery was the only risk factor (Table 6). However, there was no influence factor for all items, including age at surgery in the u70 and o71 groups. Additionally, preoperative height, weight, bilateral TKA, ROM, FTA, and JOA score did not affect mortality in the four groups.
Table 6. Analysis of preoperative clinical data of female OA patients by Cox Proportional Hazard Model
pre-operative variable data
130 survivals (M±SD)
57 deaths (M±SD)
Hazard ratio
95% CI
P value
age at operation
72.3±5.7
75.5±5.0
1.0957
1.033-1.163
0.003
height (cm)
151.4±6.0
150.6±6.8
1.0600
0.963-1.074
0.545
body weight (kg)
57.8±8.6
54.8±8.9
0.9793
0.941-1.019
0.307
Unilateral:1, bilateral:2
1.4±0.5
1.5±0.5
1.0600
0.596-1.885
0.843
ROM (degree)
104.3±19.4
106.8±19.9
1.0077
0.992-1.024
0.346
JOA total score
48.3±10.3
44.8±10.9
0.9851
0.957-1.015
0.316
FTA
186.4±6.7
187.0±6.7
1.0042
0.961-1.049
0.852
FTA; femorotibial angle, JOA; Japanese Orthopaedic Association, ROM; range of motion.
Discussion
The most important findings of this study are that the sur- vival rate 20 years after TKA was significantly lower in the RA group than in the OA group (Fig.1, Table 3). There was no significant difference in CSR between the RA-u70 group and the OA-o71 group. The survival curve for RA-u70 was similar to that of OA-o71.
The SMR of the female RA group was as high as 1.97 after 5 years, 3.49 after 10 years, and 4.59 after 20 years (Table 2). The SMR of the female OA group was 0.41 after 5 years, 1.15 after 15 years, and 1.31 after 20 years.
The preoperative factors affected survival were age at sur- gery, RF titer, and steroid-use in the RA-u70 group. In the RA-o71 group, CRP was an additional risk factor, instead of RF. In the OA group, only age at TKA was a risk factor for mortality.
The above results were obtained by investigating patients with RA and OA who were operated on by one surgeon and followed by the same surgeon. The surgeon has a unique trait being as a board-certified rheumatologist as a board- certified orthopedic surgeon, and he is keen on interested in treating patients with rheumatic diseases (i.e., RA and OA) on his own over the perioperative and postoperative periods. The data was not influenced by surgeons’ and rheu- matologist’ differences in treatment, which suggesting that the exploited outcomes were less vulnerable isolated from potential confounding issues.
In this retrospective study, we followed 328 patients with RA and OA with 460 primary TKAs from 22 August 1997 to 17 December 2007 for up to 21 years. Because more than 80% of the RA and OA patients were women in this study, the analysis was performed primarily for female patients.
To the best our knowledge, no reports have compared the CSRs of RA and OA after TKA by age group.
CSR in Female Patients
The CSRs of patients in the RA-u70 group who underwent TKA at a mean age of 58.9 years and patients in the OA-o71 group, with a mean age of 76.2 years, showed similar surviv- al curves. The CSR of the RA-o71 patients, who underwent TKA at a mean age of 74.6 years, was significantly lower than for the OA-o71 patients, who underwent TKA at a mean age of 76.2 years.
When Comparing the RA-u70 and OA-o71 female groups re- garding respect to death, the mean age at surgery of the RA- u70 group was approximately 15 years younger and the time to death of two groups was approximately 10 years. Because the SMR of the OA-o71 group was not different from that of the general population, it can be said that RA patients who underwent TKA under 70 years of age had similar mortality rates as the general population, which was 15 years older.
Although there are few reports evaluating the mortality of elderly-onset RA, mortality for seropositive elderly-onset RA is higher than that of the general population [32]. How- ever, the studies did not find any difference in seronegative RA [33]. The mortality rate of the RA-o71 group was 58.2 per 1000 person-years. These results show that RA is a more serious condition than OA. Special attention should be paid to survival prognosis when it becomes necessary to perform TKA in elderly RA patients.
Comparison of SMRs
SMR is a method of comparing the mortality rate of a cohort with the mortality rate of the general population of the area. SMR constitutes the number of deaths in the cohort divided by the expected deaths of the general population. The re- ported SMR in patients with RA-TKA is 0.81 (95% CI: 0.52- 1.25), with a mean follow-up period of 5.4 years [6]. Accord- ing to our findings, the SMR of female RA patients was as high as 1.97 (95% CI: 0.96–3.89) after 5 years and signifi- cantly higher 10-20 years after surgery. These results were similar to Böhm and colleagues’ report [2].
RA patients who have not undergone surgery have a higher mortality rate than the general population [22, 24, 25, 34]. Shourt and colleagues reported that RA patients who underwent joint reconstructive procedures have higher mortality rates than RA patients who have not undergone surgery [26]. Among patients with RA, those who undergo TKA have a high disease activity and are severe cases.
The SMR was 0.41 in female patients with OA 5 years after TKA in this study. Several reports found that SMR was de- creased than that in the general population 5-10 years after TKA [2, 6, 8, 9, 11-13]. This is because healthier people are selected for surgery [9, 13]. Ravi and colleagues reported that TKA reduced cardiovascular events [35]. On the con- trary, some reports indicated that SMR increases long-term in patients with OA after TKA, but the cause has not been clarified [12, 13]. The results of our 20-year follow-up study showed that the SMR did not differ from that of the general population.
However, several reports indicated that the mortality rate in patients with knee OA with symptoms is higher than that in the general population without OA [27-30, 35]. It has been reported that dysfunction and pain increased mortality rates [30], and that subjects with symptomatic OA are likely to take non-steroidal anti-inflammatory drugs, which are associated with excess mortality from gastrointestinal and cardiovascular diseases [29].
Combined with the report indicating that the survival rate of OA patients undergoing TKA was higher than that of OA patients receiving conservative therapy [7] and our results, TKA should be actively considered for symptomatic OA pa- tients with K-L classification grade 3 or 4.
Preoperative Risk Factors Associated with Mortality
Analysis of the Cox proportional hazards model of female patients showed that the RA group had significant hazard ratios for age at TKA, RF titer, and steroid-use; we did not see any effect for biological administration. This result was similar to previously described risk factors for RA patients without surgery [5, 25].
The RA-u70 group had similar results to the RA group (Table IV), but in the RA-o71 group, CRP was a risk factor instead of the RF titer (Table V). We considered that this was because the difference in RF titers between survivals and deaths is lower in the o71 group than in the u70 group, and the RF titers of deaths in the o71 group were lower than in the u70 group (Table IV, V).
In the patient of elderly-onset RA with a high disease activ- ity, it is necessary to control inflammation regardless of the RF titer. More follow-up studies and a detailed analysis of mortality in more elderly-onset RA patients are needed.
In the group of women with OA in this study, age at the time of operation was the only risk factor for mortality (Table VI). Sub-analysis of the u70 and o71 groups identified no risk factors, including age.
Age and Cause of Death After TKA
The mean life expectancy of Japanese people in 2017 was 87.3 years for women and 81.1 years for men [1]. In this study, the mean age at death of OA-o71 was 87.2 years for women and 85.3 years for men. Patients with knee OA who undergo TKA after the age of 71 are likely to be able to live in an environment similar to people with few physical ab- normalities or to be selected for TKA, even though they are older. However, because we were unable to investigate co- morbidities, we could not draw a definitive conclusion on this issue, and further research is needed.
According to statistics regarding on causes of death in Japa- nese people, malignant tumors were the most common, followed by heart disease and cerebrovascular disease [1]. This tendency was similar in the OA group [9, 27, 28]. On the contrary, in the RA group, many deaths were due to respi- ratory diseases, infectious diseases, renal dysfunction, and multiple organ failure, as in previous reports [23-25].
There are many limitations in this study. The number of pa- tients analyzed might be considered relatively low for this type of study; especially with regard to the number of male patients. Complications, such as comorbidities, American Society of Anesthesiologist grade, and smoking, were not investigated. Despite these limitations, this study has sev- eral advantages, including that all patients with OA and RA were operated by a single doctor and underwent the same postoperative rehabilitation protocol and received the same basic medications, especially in RA patients, and follow-up with the same doctor in a single hospital.
Conclusions
The CSR was higher in patients with OA versus RA. The sur- vival rate of the women in the OA-u70 group was highest, similar for RA-u70 and OA-o71, and particularly poor in the RA-o71 group. The survival curves for the RA-u70 and the OA-o71groups were similar over the course of the follow-up.
The SMR was significantly higher for women with RA. In OA patients SMR was lower than that of the general population after 5 years and was 1.1 after 15 years.
The preoperative factors that affected survival were age at surgery, RF titer, and steroid use in the RA-u70 group. In the RA-o71 group, CRP was an additional risk factor, instead of RF. In the OA group, only age at TKA was a risk factor.
In patients with RA over 71 years of age with a high disease activity, it is necessary to control inflammation regardless of the RF titer. TKA should be actively considered in patients with advanced knee osteoarthritis.
Author contributions: Study coauthors contributed sub- stantially to the conception or design of the work (FY), data acquisition (HI, HF, HN, TS, SH, YS, YT), data analysis (FY, DM, KK, MI), statistical analysis (FY, KK), interpretation of results (MK, YM, HF, YS, TS, SH), drafting the work (FY), re- vising the work critically and providing final approval of the manuscript (FY, NF, DM, KK,). FY takes responsibility for the integrity of the work as a whole.
Acknowledgments: The authors acknowledge the efforts of all participating patients and families, and orthopaedic sur- geons, nurses and secretaries at the Department of Orthope- dic Surgery and Rheumatology, Kyoto Shimogamo Hospital.
We thank Jane Charbonneau, DVM, from Edanz (https:// jp.edanz.com/ac) for editing a draft of this manuscript.
IRB approval: This research has been approved by the IRB of the authors’ affiliated institutions.
Funding: This research did not receive any specific grant from funding agencies in the public, commercial, or not-for- profit sectors.
Conflict of interest: The authors declare no conflicts of interest to this work.
References
Ministry of Health, Labour and Welfare of Japan (mhlw. go.jp) (2018). [Crossref]
Shrøder HM., Kristensen PW., Petersen MB., Nielsen PT (1998) Patient survival after total knee arthroplasty5-year data in 926 patients. Acta Ortop Scand 69: 35-38. [Crossref]
Böhm P., Holy T., Pietsch-Breitfeld., Meisner C (2000) Mor- tality after total knee arthroplasty in patients with osteoar- throsis and rheumatoid arthritis. Arch Orthop Traima Surg 120: 75-78. [Crossref]
Clement ND., Jenkins PJ., Brenkel IJ., Walmsley P (2012) Predictors of mortality after total knee replacement: a ten- year survivorship analysis. J Bone Joint Surg Br 94: 200-204. [Crossref]
Cordtz RL., Zobbe K., Kristensen LE., Højgaard P., Kristensen LE., et al. (2018) Predictors of revision, prosthetic joint in- fection and mortality following total hip or total knee ar- throplasty in patients with rheumatoid arthritis: a nation- wide cohort study using Danish healthcare registers. Ann Rheum Dis 77: 281-288.
Ohzawa S., Takahara Y., Furumatsu T., Inoue H (2001) Pa- tients Survival after total knee arthroplasty. Acta Med. Okayama 55: 295-299. [Crossref]
Misra D., NaLu., Felson D., Choi HK., Seeger J., et al. (2017) Does knee replacement surgery for osteoarthritis improve survival? The jury is still out. Ann Rheuma Dis. 76: 140-146. [Crossref]
Choi HG., Kwon BC., Kim J Il., Lee JK (2020) Total knee ar- throplasty reduces the risk of mortality in osteoarthritis patients up to 12 years: A Korean national cohort longitu- dinal follow-up study. Journal of Orthopaedic Surgery 28: 1-8, [Crossref]
Hunt LP., Ben-Shlomo Y., Whitehouse MR., Porter ML., Blom AW (2017) On behalf of the National Joint Registry for England, Wales, Northern Ireland and the Isle of Man. The main cause of death following primary total hip and knee replacement for osteoarthritis. A cohort study of 26,766 deaths following 332,734 hip replacements and 29,802 deaths following 384,291 knee replacements: J Bone Joint Surg Am: 99: 565-575.
Ishii Y., Noguchi H, Sato J., Ishii H., Takayama S., et al. (2017) Life expectancy of osteoarthritic patients after pri- mary total knee arthroplasty. J Clin Orthop Trauma S57- S61. [Crossref]
Büchele G., Günther KP., Brenner H., Puhl W., Stürmer T., et al. (2018) Osteoarthritis-patterns, cardiometabolic risk factors and risk of all-cause mortality: 20 years follow-up in patients after hip or knee replacement. Scientific Reports 8: 5253.
Harris IA., Hatton A., Pratt N., Lorimer M., Naylor JM., et al. (2019) How does mortality risk change over time after hip and knee arthroplasty? Clin Orthop Relat Res 477: 1414- 1421. [Crossref]
Robertsson O., Stefánsdóttir A., Lidgren L., Ranstam J (2007) Increased long-term mortality in patients less than 55 years old who have undergone knee replacement for osteoarthritis: results from the Swedish Knee Arthroplasty Register. J Bone Joint Surg Br 89: 599-603. [Crossref]
Arnett FC., Edworthy SM., Bloch DA., McShane DJ., Fries JF., et al. (1988) The American Rheumatism Association 1987 revised criteria for the classification of rheumatoid arthritis. Arthritis Rheum 31: 315-324. [Crossref]
Kellgren JH., Lawrence JS (1957) Radiological assessment of osteo-arthrosis. Ann Rheum Dis 16: 494-502. [Crossref]
Koshino T., Ikeuchi H., Kurosawa H., Niwa S., Okamoto R., et al. (1988) Criteria for evaluating rheumatoid arthritis of the knee: the committee on Assessment criteria for knee disease and treatments of the Japanese Orthopaedic As- sociation. J Jpn Orthop Assoc 62: 900. [Crossref]
Bhandari M., Pascale W., Sprague S., Pascale V (2012) The Genesis II in primary total knee replacement: A system- atic literature review of clinical outcomes. Knee 19: 8-13. [Crossref]
Ministry of Health, Labour and Welfare of Japan (2018) (mhlw.go.jp).
Hanyu T., Murasawa A., Tojo T (1997) Survivorship analysis of total knee arthroplasty with the kinematic prosthesis in patients who have rheumatoid arthritis. J Arthroplas 12: 913-919. [Crossref]
Ito J., Koshino T., Okamoto R., Saito T (2003) 15-year fol- low-up study of total knee arthroplasty in patients with rheumatoid arthritis. J Arthroplas 18: 984-992. [Crossref]
Kaneko A., Eto Y., Tsukamoto M (2004) Survival after to- tal joint arthroplasty in patients with rheumatoid arthritis. Comparison of the postoperative life expectancies and sur- vival by initial operative years: 1970s and 1980s group ver- sus 1990s group. Mod Rheumatol 14: 466-469. [Crossref]
Gonzalez A., Kremers HM., Crowson CS., Nicola PJ., Davis, III JM, et al. (2007) The widening mortality gap between rheumatoid arthritis patients and the general population. Arthritis Rheum 56 :3583-3587. [Crossref]
Widdifield J., Paterson JM., HuangA,Bernatsky S (2018) Causes of death in rheumatoid arthritis: How do they compare to the general population? Arthritis Care Res 70: 1748–1755. [Crossref]
Van den Hoek J., Boshuizen HC., Roorda LD., Tijhuis GJ., Nurmohamed MT., et al. (2017) Mortality in patients with
Nakajima A., Inoue E., Tanaka E., Singh G., Sato E., et al. (2010) Mortality and cause of death in Japanese patients with rheumatoid arthritis based on a large observational cohort, IORRA. Scand J Rheumatol 39: 360-367. [Crossref]
Shourt CA., Crowson CS., Gabriel SE., Matteson EL (2012) Orthopedic surgery among patients with rheumatoid ar- thritis 1980-2007: A population-based study focused on surgery rates, sex, and mortality. J Rheumatol 39: 481-485. [Crossref]
Kasai T., Hasegawa Y., Imagama S., Sakai T., Wakai K., et al. (2017) The impact of muscloskeletal diseases on mortality- comparison with internal diseases: A 15-year longitudinal study. J Orthop Sci 11: 1126-1131. [Crossref]
Tsuboi M., Hasegawa Y., Matsuyama Y., Suzuki S., Suzuki K., et al. (2011) Do musculoskeletal degenerative diseases af- fect mortality and cause of death after 10 years in Japan? J Bone Miner Metab 29: 217-223. [Crossref]
Liu Q., Niu J., Huang J., Ke Y., Tang X., et al. (2015) Knee osteoarthritis and all-cause mortality: the Wuchuan Os- teoarthritis Study. Osteoarthritis Cartilage 23: 1154-1157. [Crossref]
Cleveland RJ., Alvarez C., Schwartz TA., Losina E., Renner JB., et al. (2019) The impact of painful knee osteoarthritis on mortality: a community-based cohort study with over 24 years of follow-up. Osteoarthritis Cartilage 27: 593-602. [Crossref]
Hawker GA., Croxford R., Bierman AS., Harvey PJ., Ravi B., et al. (2014) All-cause mortality and serious cardiovascular events in people with hip and knee osteoarthritis: A popu- lation base ohort study. PLoS One 9: e91286. [Crossref]
Schaardenburg DV., Hazes JM., Boer AD., Zwinderman AH., Meijers KA., et al. (1993) Outcome of rheumatoid arthri- tis in relation to age and rheumatoid factor at diagnosis. J Rheumol J 20: 45-52. [Crossref]
Calvo-Allén J., Corrales A., Sánchez-Andrada S., Fernández- Echevarría MA., et al. (2005) Outcome of late-onset rheumatoid arthritis. Clin Rheumatol 24: 485-489. [Crossref]
Nakajima A., Saito K., Kojima T., Amano K., Yoshio T., et al. (2013) No increased mortality in patients with rheumatoid arthritis treated with biologics: results from the biologics register of six rheumatology institutes in Japan. Mod Rheu- matol 23: 945-952. [Crossref]
Ravi B., Croxford R., Austin PC., Lipscombe L., Bierman AS., et al. (2013) The relation between total joint arthroplasty and risk for serious cardiovascular events in patients with moderate-severe osteoarthritis: propensity score matched landmark analysis. BMJ 347: 6187. [Crossref]
Editorial Information
Article Type
Research Article
Publication history
Received date: January 14, 2022
Accepted date: January 28, 2022
Published date: February 08, 2022
Yamashita F, Kobayashi M, Mizuno Y, Funakoshi N, Ito H, et al. (2022) Comparison of Survival Rate After Total Knee Arthroplasty in Patients with Rheumatoid Arthritis and Osteoarthritis. OSP Journal of Health Care and Medicine 3: HCM-3-133.
Corresponding author
Fumiharu Yamashita
Department of Orthopedic Surgery and Rheumatology, Kyoto Shimogamo Hospital, 606-0866 Higashimorigamae-cho 17, Shimogamo, Sakyo-ku, Kyoto, Japan. yf194304@gmail.com
Figure 1. Cumulative survival curve of female patients with rheumatoid arthritis and osteoarthritis.
OA: osteoarthritis, RA: rheumatoid arthritis, log-rank test 0.005
Figure 2. Cumulative survival curves of female patients with RA and OA divided into the u70 and o71 groups
OA: osteoarthritis, RA; rheumatoid arthritis, u70; under 70 years old, o71; over 71 years old
Table 1. Variable of RA-u70, RA-o71, OA-u70 and OA-o71 groups
RA-u70
RA-o71
OA-u70
OA-o71
patients (joints)
75 (111)
43 (58)
67 (83)
140(203)
female (%)
66 (88.0)
40 (93.0)
56 (82.8)
131 (92.9)
age at operation (y)
58.9±8.5
74.6±2.7
66.5±3.8
76.2±3.7
height
155.4±7.4
150.5±7.4
154.7±8.0
151.2±6.7
body weight
51.0±9.7
47.9±7.7
62.2±10.7
56.3±8.9
BMI
21.1±3.4
21.1±2.6
25.9±3.6
24.6±3.2
bilateral TKA (pts)
38 (50.7%)
13 (30.2%)
21 (31.3%)
61 (43.6%)
CR type
93 (83.8%)
54 (93.1)
68 (82.0%)
172 (84.7%)
ROM
90.2±31.7
98.5±25.1
103.6±18.1
106.3±18.1
JOA total score
46.2±13.1
51.9±8.9
48.5±11.2
47.5±10.0
FTA
174.9±8.0
177.6±6.9
186.5±6.4
186.3±6.8
follow-up period (y)
14.0±4.5
10.8±4.5
14.7±4.1
12.1±3.9
Death patients (female)
27 (25)
27 (25)
17 (11)
50 (46)
age at death
71.8±7.2
84.4±5.6
79.9±5.3
87.1±5.8
CR: cruciate retention, FTA; femorotibial angle, JOA; Japanese Orthopaedic Association, OA; Osteoarthritis, o71; over 71 years old, pts; pa- tients, RA; rheumatoid arthritis, ROM; range of motion, TKA; total knee arthroplasty, u70; under 70 years old, y; year.
Table 2. Standardized mortality rates every 5 years for each sex and each group