HMOX1 (HO-1) might be involved in the mechanism of polychlorinated biphenyl (PCB)-induced tumorigenic effects through influences on iron-metabolism factors. This work aimed to investigate the in-vitro effect of HO-1 silence on the PCBs treated BC cells.
The breast cancer cell lines MCF-7 and MDA-MB-231 were used for analysis of in-vitro functions. HO-1 siRNA was used for HO-1 knocking down. The PCBs applied in this work were constituted by equal amount of PCB77, PCB126, and PCB153. The expression of ferrportin, ferritin and hepcidin were assessed by Western blot and Realtime PCR. The intracellular SOD and Malondialdehyde (MDA) levels in plasma were measured using the ELISA method. Intracellular ROS intensity was determined by flow cytometry.
For both BC cell lines, PCB exposure enhanced cell proliferation, proportion of cells in the G2 and M phases, migration, and invasion abilities. HO-1 siRNA treatment significantly blocked these effects. PCBs exposure significantly decrease the mRNA levels of ferrportin, ferritin and hepcidin; while HO-1 siRNA treatment recovered their expression. Additionally, PCB exposure elevated the ROS and MDA levels in two cells; siRNA treatment groups kept normal levels under the PCB stress. Finally, intracellular SOD levels were decreased by PCB treatment, HO-1 silence recovered the SOD levels in both cell lines.
In conclusion, the carcinogenic effect of PCBs depends on the presence of HO-1 and is associated with the iron metabolism related factors. Silence of HO-1 can suppress the oxidative stress, recover the expression of iron metabolism members, and attenuate the in-vitro carcinogenic activity of PCBs.
Breast cancer; HMOX1; Iron Metabolism; Polychlorinated Biphenyl; Hepcidin
Persistent organic pollutants (POPs) can cause a series of health problems. Polychlorinated biphenyls (PCBs) are typical POPs and elicit a wide range of toxicities, such as neurotoxicity, hepatoxicity, and oncogenicity. Independent studies have proved that PCBs are important causes of tumorigenesis [1-4]. PCBs were widely produced and used in the 20th century, and they have been banned globally. However, due to their stable characteristics and long-term accumulation, their detriments are still serious health risks. Daily food including seafood, fat, oil, etc., are sources of PCBs for human. The ingested PCBs are mainly stored in adipose tissue. When pregnant, PCBs can be transmitted to the fetus through the placenta and they can also be released into breast milk [5-7]. In our pilot survey, around 90% of milk samples were detected PCBs. Breast cancer (BC) is one of the most common and mortal female malignances [8, 9]. Concerns about the correlation between PCBs and BC started with the estrogen effect of PCBs, but so far, there is still huge controversy. Published articles have indicated their association with BC onset, metastasis and survival [10-13]. However, the deeper mechanisms and key factors mediating the damage from PCBs remain obscure. For example, PCB105, PCB108, PCB170, and PCB180 do not have an estrogen effect, suggesting that their BC-promoting effects are not limited to estrogen effects. Our previous work on hepatoma carcinoma cells and macrophages observed that PCB exposure significantly enhanced the intracellular ferritin level and caused iron overload. Besides, two key genes in iron metabolism, hepcidin and ferroportin, were decreased in expression. So far, the suppressed hepcidin expression has still been believed to be mediated through an estrogen-like effect associated with disordered systemic iron homeostasis [14]. Therefore, we proposed the disorders in iron metabolism might be involved in the process of PCB-induced BC development.
On the other hand, Heme metabolism is closely related to iron metabolism/balance [15-17]. Two-thirds of body iron stores are estimated to originate from heme, which accounts for only one-third of total dietary iron content [18]. HMOX1 (Heme oxygenase, HO-1) is an essential enzyme in heme catabolism. It cleaves heme to form biliverdin, which is subsequently converted to bilirubin by biliverdin reductase, and carbon monoxide, a putative neurotransmitter. HO-1 plays an important role in the tumor growth and spread, and its expression is positively regulated by Nrf2 [19]. Moreover, up-regulation of HO-1 in astrocytes promotes pathological brain iron deposition and oxidative mitochondrial damage [20]. Additionally, HO-1 was regarded as a marker of iron excess-induced adipose tissue dysfunction [21]. It has been shown that HO-1 promotes polychlorinated biphenyl mixture aroclor 1254-induced oxidative stress and dopaminergic cell injury [22]. This is a departure from our study. In our pilot experiment, PCBs enhanced the HO-1 expression, and administration of HO-1 siRNAs blocked the suppressive effect the PCBs on iron metabolism related factors (ferritin and hepcidin). Therefore, we hypothesized the HO-1 was involved in the mechanism of PCB-induced tumorigenic effects through influences on iron-metabolism factors. This work aimed to investigate the in-vitro effect of HO-1 silence on the PCBs treated BC cells.
Cell Culture
The breast cancer cell lines MCF-7 and MDA-MB-231 were purchased from the ATCC cell bank. Cells were cultured in the RPMI-1640 medium (Invitrogen, Thermo Fisher Scientific, USA) containing 10% FBS (Invitrogen, Thermo Fisher Scientific, USA), 100 U/ml penicillin, and 100 mg/ml streptomycin. All cells were placed in a 5% CO2 incubator at 37 °C with saturated humidity.
HO-1 knocking down
Cells were divided into two groups: Vehicle group (Control) and HO-1 siRNA group (si-HO-1). The Lipofectamine 3000 (L3000001, Thermo Fisher, USA) transfection reagent was used. Add Lipofectamine 3000 into serum-free medium in a 1.5 ml EP tube, mix well and incubate for 5 min, then add appropriate amount of DNA, mix well and incubate for 15 min, then gently drop into the cells. Forty-eight hours after transduction, the transfection was validated by HO-1 expression assessment using Western blot and Realtime PCR. The primer sequences for the internal reference GAPDH and the target gene HO-1 were purchased from Sangon Biotech (Shanghai, CHN).
HO-1: Forward primer 5′-AGGCCAAGACTGCGTTCCT-3′, Reverse primer 5′-AACTGTCGCCACCAGAAAGCTGAG-3′; GAPDH: Forward primer 5′-GAGTCAACGGATTTGGTCGT-3′, Reverse primer 5′- TTGATTTTGGAGGGGATCTCG-3′.
PCB Treatment
When the cell density reached 70-80%, PCBs (GO-NEF-83, SPEX Certi Prep, USA) were added to a final concentration of 30 nM to continue incubation for 24 h. Cells were subsequently digested and collected for subsequent experiments.
Western Blot Analysis
Cells were collected and were homogenized in a lysis buffer for 30 min on ice. The lysates were centrifuged at 12000 g at 4˚C for 10 min, and supernatants were collected. Protein samples were separated using 10% SDS-PAGE and transferred onto PVDF membranes. Membranes were first blocked in TBST-milk and then incubated with different antibodies overnight. Following HO-1 (1:1000, #43966, CST, USA) and GAPDH (1:1000, #5174, CST, USA) were used: After 3 times of wash with TBST, membranes were incubated with Anti-rabbit IgG, HRP-linked Antibody (1:1000, #7074, CST, USA). The target blots were visualized using an enhanced chemiluminescence kit (Beyotime, China).
Real-Time Quantitative PCR
Cells were lysed by Trizol for 5 min, added with 0.2 ml of chloroform (every 1 ml Trizol), and shaken for 20 s. After centrifugation (12000 g, 15 min, at 4°C), the supernatant was added with half volume of isopropanol and centrifuged again. The supernatant was discarded and sediments (containing total RNAs) were washed by ethanol twice. RNA samples were air-dried for 15 min and around 20 μL of DEPC ddH2O was added to the RNA pellet. RNAs were reverse transcribed into cDNAs and diluted to the same concentration. The primers of HO-1, Nrf2, Hepcidin, Ferroportin and Ferritin were synthetized by Sangon Biotech (China). The PCR reaction system was 10 ul, including 0.8 μL of ddH2O, 0.2 μL of primers, 4 μL of templates, and 5 μL of the SYBR Green reagent. For all genes, the PCR reaction process was: 95°C for 5 min; 50 cycles of 95°C for 10 s and 60°C for 20 s. The primers were as follow.
HO-1:Forward primer 5′-AGGCCAAGACTGCGTTCCT-3′, Reverse primer 5′-AACTGTCGCCACCAGAAAGCTGAG-3′
Nrf2: Forward primer 5′- TCCGCTGCCATCAGTCAGTC-3′, Reverse primer 5′- ATTGTGCCTTCAGCGTGCTTC-3′
Hepcidin: Forward primer 5′-TCCGTTCTCCCATCCCAGAC-3′, Reverse primer 5′- GCAGCACATCCCACAGATTG -3′
Ferroportin:Forward primer 5’-AGGCAAGATGGCACTAAGCAC-3’ ,Reverse primer 5’-TCTATGTTATGCAACAGACAT-3’
Ferritin:Forward primer 5’-CCAATTTCAAGTGAGTACGCC -3’ ,Reverse primer 5’-AAACACCCAAACCATCGCC -3’
GAPDH:Forward primer 5′-GAGTCAACGGATTTGGTCGT-3′, Reverse primer 5′- TTGATTTTGGAGGGGATCTCG-3′
Cell Viability Assay
The cell viability was determined by the CCK8 assay method. Different groups of MCF-7 and MDA-MB-231 cells were seeded on 96-well plates at 10000 cells/well. After attachment, cells were incubated with PCB (30 nM) or/and HO-1 siRNA (2 μg/ml), as well as corresponding vehicles, and cultured for 72 h. The cell proliferation was assessed. CCK8 agent (Dojindo, Japan) was added, 2 hour later, the absorbance at 450 nm was determined by a microplate reader. Each experiment was performed in triplicate.
Cell Cycle Analysis
Different groups of MCF-7 and MDA-MB-231 cells were cultured in a density of 105 cells/well in the 24-well plates and treated with PCB (30 nM) or/and HO-1 siRNA (2 μg/ml), as well as corresponding vehicles for 48 h. Cells of each well were washed with cold PBS, treated with 70% ethanol at 4˚C overnight. Afterwards, cells were gently suspended, and the density was adjusted to 106 cells/ml. They were stained with propidium iodide (PI, 0.1 mg/mL PI, Sigma-Aldrich, MO, USA) for 20 min at 4°C in dark and then analyzed by flow the cytometry analysis (by the Beckman Coulter flow cytometer, CA). The distribution of each cell cycle was acquired by the cytometry analysis system. This experiment was performed in triplicate.
Cell Migration
Different groups of cells were seeded in a 6-well plate at 106 /well. After fully adherent to the wall, straight lines were scratched with a pipette tip, the culture was washed with PBS to remove debris and add serum-free medium. The cells were incubated at 37℃ in a 5% CO2 incubator; samples were taken at 0 and 24 hours, and the migration of cells at specific locations was observed by inverted microscope and photographed. Relative migration distance (normalized by the control group) was compared among groups. This experiment was performed in triplicate.
Cell Invasion
Different groups of cells (100 μL of the cell suspension, with a density of 106 cells/ml) were added to the upper layer of the trans-well chamber for invasion test. After 24 hours of incubation, the medium in the wells was discarded, washed three times with PBS, and fixed with 4% paraformaldehyde for 30 min, then washed three times with PBS and stained with 0.1% crystal violet for 20 min. After washed three times with PBS, the stained cells were allowed to air-dry naturally and were observed under the microscope. Five 200x visual fields were captured for each well, and the average cell number in one visual field was calculated. Three independent in-vitro experiments were performed.
ROS Intensity Assessment
Intracellular ROS intensity was determined by flow cytometry. Different groups of cells were harvested and treated with the fluorescent probe DCFH-DA. The cell density was adjusted to 106 cells/ml, and 50000 cells were used to perform the flow cytometry. The ROS intensity was calculated by the flow cytometer. Three independent in-vitro experiments were performed to acquire the average results.
ELISA Assay
The intracellular SOD and Malondialdehyde (MDA) levels in plasma were measured using the ELISA method. The Cayman® assay kit (Cayman, Ann Arbor, MI) was used to detect three types of SODs (Cu/Zn, Mn, and Fe SODs). MDA was determined using the competitive inhibition enzyme immunoassay technique (Cusabio®). Samples are added to the wells with horseradish peroxidase (HRP) conjugated MDA or SODs and incubated. All protocols were performed in accordance with the official guidance. Each experiment included 3 samples.
Statistical Analysis
All data were expressed as the mean with standard errors. For each cell line, comparison was performed using Student's t-test between two groups or One-way ANOVA among more than two groups. Data was visualized by the GraphPad Prism software. For all the presented data, p <0.05 was considered statistically significant.
Knockdown Efficiency Validation
First, we verified the knockdown efficiency of HO-1 siRNA through the expression levels of mRNA and protein. In MCF-7, the HO-1 mRNA level was decreased to around 16.8% (p < 0.01, vs control) (Fig. 1A) and the protein level was decreased to 9.3% (p < 0.01, vs control) (Fig. 1B). Similarly, in MDA-MB-231, the mRNA level was decreased to around 19.8% (p < 0.01, vs control) (Fig. 1A) and the protein level was decreased to 26.5% (p < 0.01, vs control) (Fig. 1B). The validated knockdown efficiency ensured the in-vitro impacts of HO-1 deficiency.
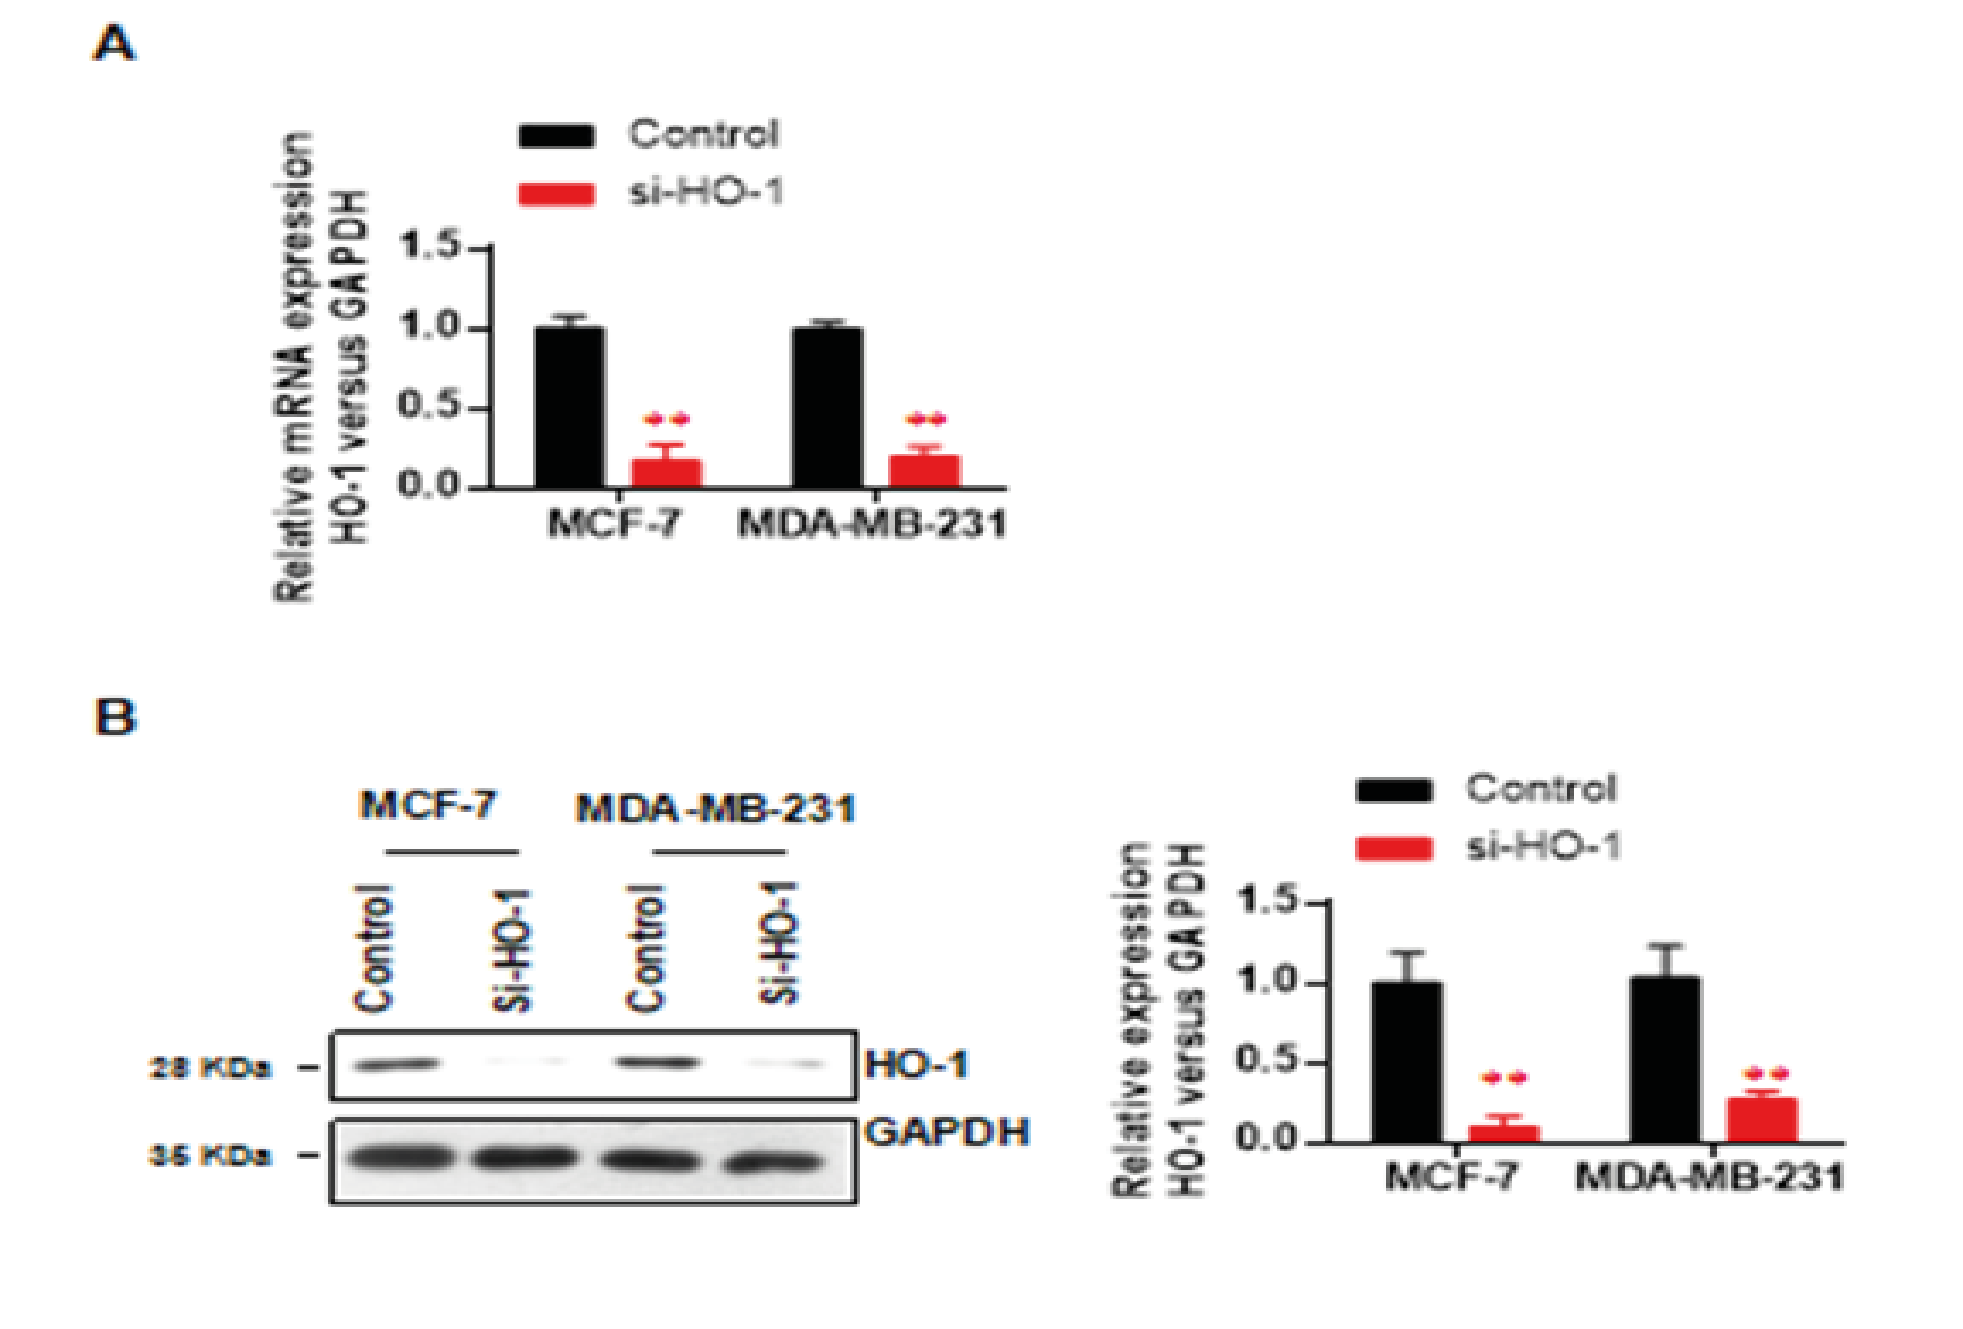
Figure 1: Knockdown efficiency validation of HO-1.
A. HO-1 mRNA levels of two cell lines
B. the HO-1 protein levels of two cell lines.
Data represent mean ± SD; n = 3 in each group. ** p < 0.01 (si-HO-1 vs control)
HO-1 Silence Blocked the Proliferation Promoting Effect of PCB Expose
The cell viability of 72-h culture was determined by the CCK-8 method. For both BC cell lines, HO-1 silence did not influence the cell viability (p > 0.05 at each time point); and PCB exposure consistently enhanced cell proliferation (for both cell lines at 48 and 72 h, PCB vs control p < 0.01) (Fig. 2A). When PCB-exposed cells were treated with HO-1 siRNA, the cell proliferation was significantly attenuated (for both cell lines at 48 and 72 h, PCB+si-HO-1 vs PCB p < 0.01) (Fig. 2A). Further, the cell cycle distribution was analyzed using flow cytometry. In consistency, single PCB treatment increased the proportion of cells in the G2/M phases, and HO-1 siRNA treatment significantly blocked this effect (Fig. 2B). Together, HO-1 might be necessary for the proliferation promoting effect of PCB exposure.
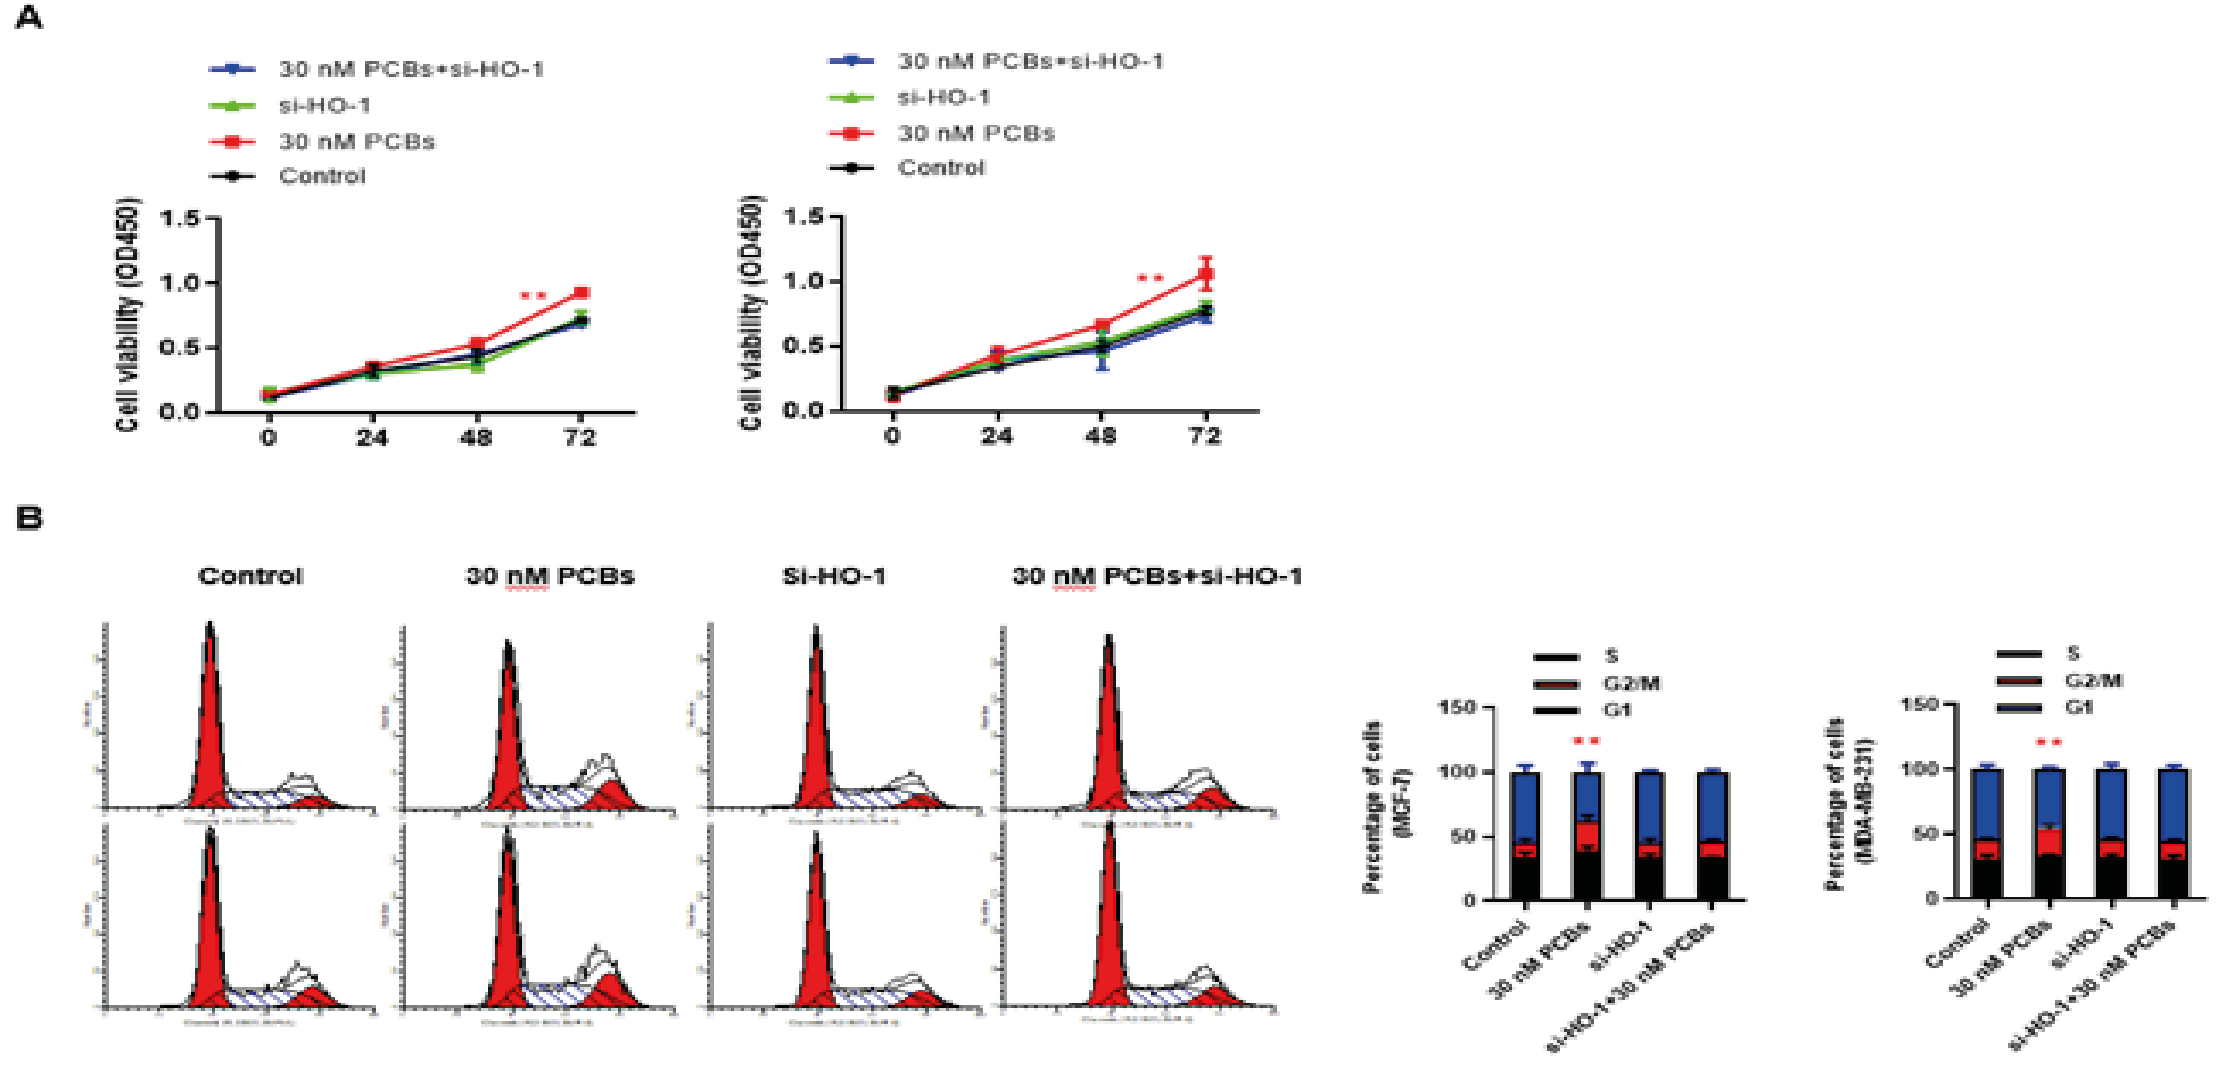
Figure 2: HO-1 silence blocked the proliferation promoting effect of PCB expose.
A. The cell viability of 72-h culture was determined by the CCK-8 method. For both BC cell lines (Left: MCF-7; Right: MDA-MB-231).
B. The cell cycle distribution of different groups in MCF-7 and MDA-MB-231 cells (Left: MCF-7; Right: MDA-MB-231).
Data represent mean ± SD; n = 3 in each group. ** p < 0.01 (PCB+si-HO-1 vs PCB)
HO-1 Silence Blocked the Migration/Invasion Promoting Effect of PCB Expose
Next, the impacts of PCB and HO-1 siRNA on in-vitro migration and invasion of BC cells were observed. In both cells, PCB exposure significantly enhanced the migration distance in 24 h compared with control, and this effect was abolished by the HO-1 siRNA treatment (PCB+si-HO-1 vs PCB p < 0.05) (Fig. 3A). Similar to migration, the invasion abilities of both BC cells were boosted by PCB, as indicated by the violet cell number at the lower layer per visual field, while HO-1 siRNA administration fully blocked this influence on invasion (PCB+si-HO-1 vs PCB p < 0.05) (Fig. 3B). Together, HO-1 was essential for the in-vitro carcinogenic role of PCB (in aspects of proliferation and migration/invasion).
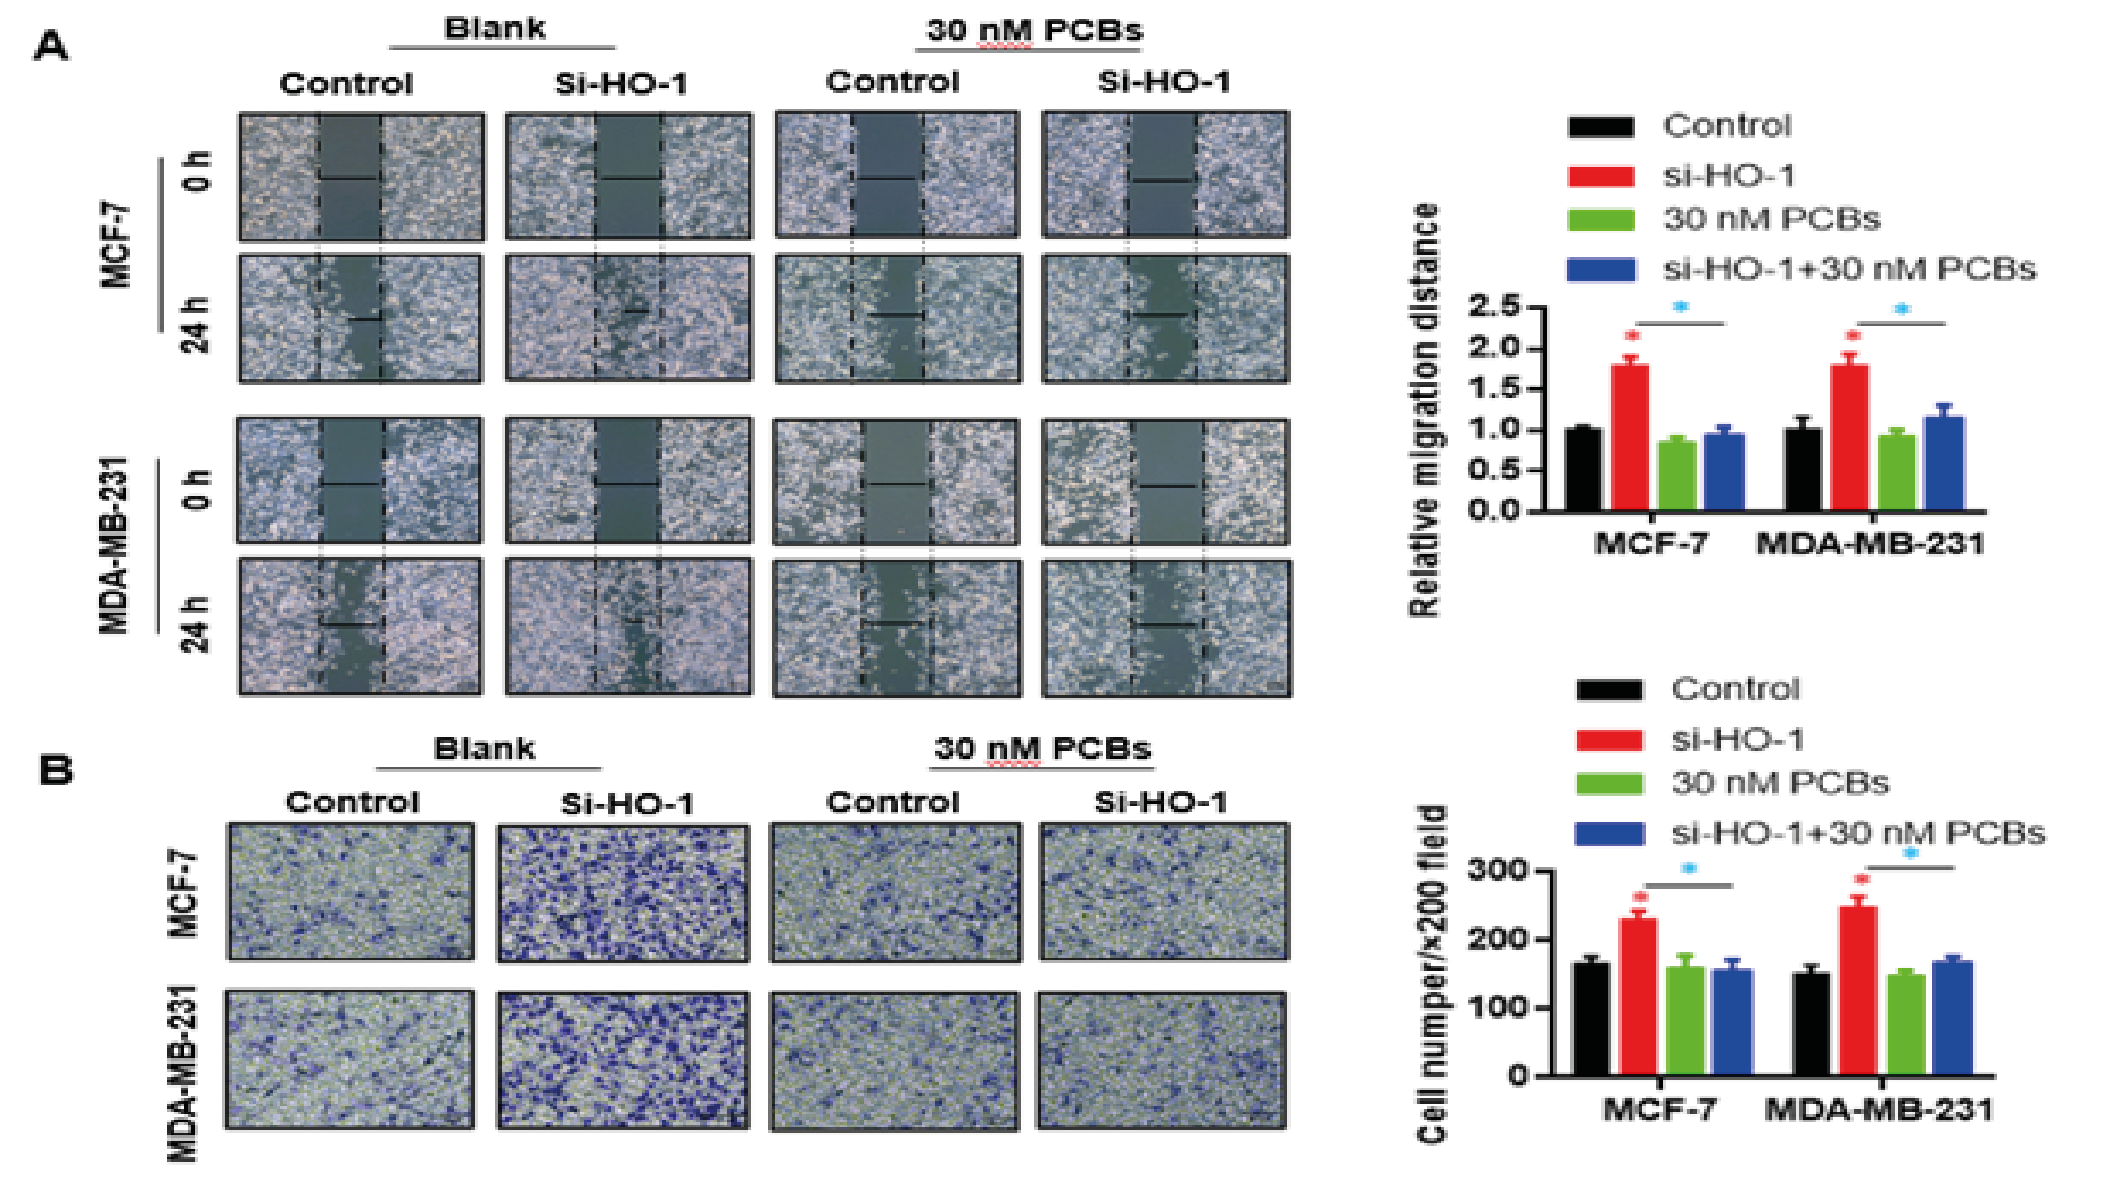
Figure 3: HO-1 silence blocked the migration/invasion promoting effect of PCB expose.
A. PCB exposure enhanced the migration distance in 24 h compared with control, and this effect was abolished by the HO-1 siRNA treatment.
B. The invasion abilities of both BC cells were boosted by PCB, which were blocked by HO-1 siRNA administration.
Data represent mean ± SD; n = 3 in each group. * p < 0.05 (Red: Control vs PCB; Blue: PCB+si-HO-1 vs PCB)
HO-1 Silence Recovered the Damage of PCB Exposure on Iron Metabolism Related Genes
We applied real-time PCR was to evaluate the mRNA expression of iron metabolism associated genes in each group, including ferrportin, ferritin and hepcidin. PCBs exposure significantly decrease the mRNA levels of above three genes (p < 0.01 PCB vs control) (Fig. 4A-C). HO-1 knocking down in the si-HO-1 and PCB+si-HO-1 groups was confirmed as Fig. 4D shown. HO-1 siRNA significantly recovered the expression of ferrportin, ferritin and hepcidin under PCB exposure (p < 0.01, si-HO-1vs PCB+si-HO-1) (Fig. 4A-C). Besides, modulation of HO-1 did not influence the expression of Nrf2 (Fig. 4E), which suggests that HO-1 is a crucial factor regulating the injury of PCBs towards downstream roles, in particular iron metabolism related genes.
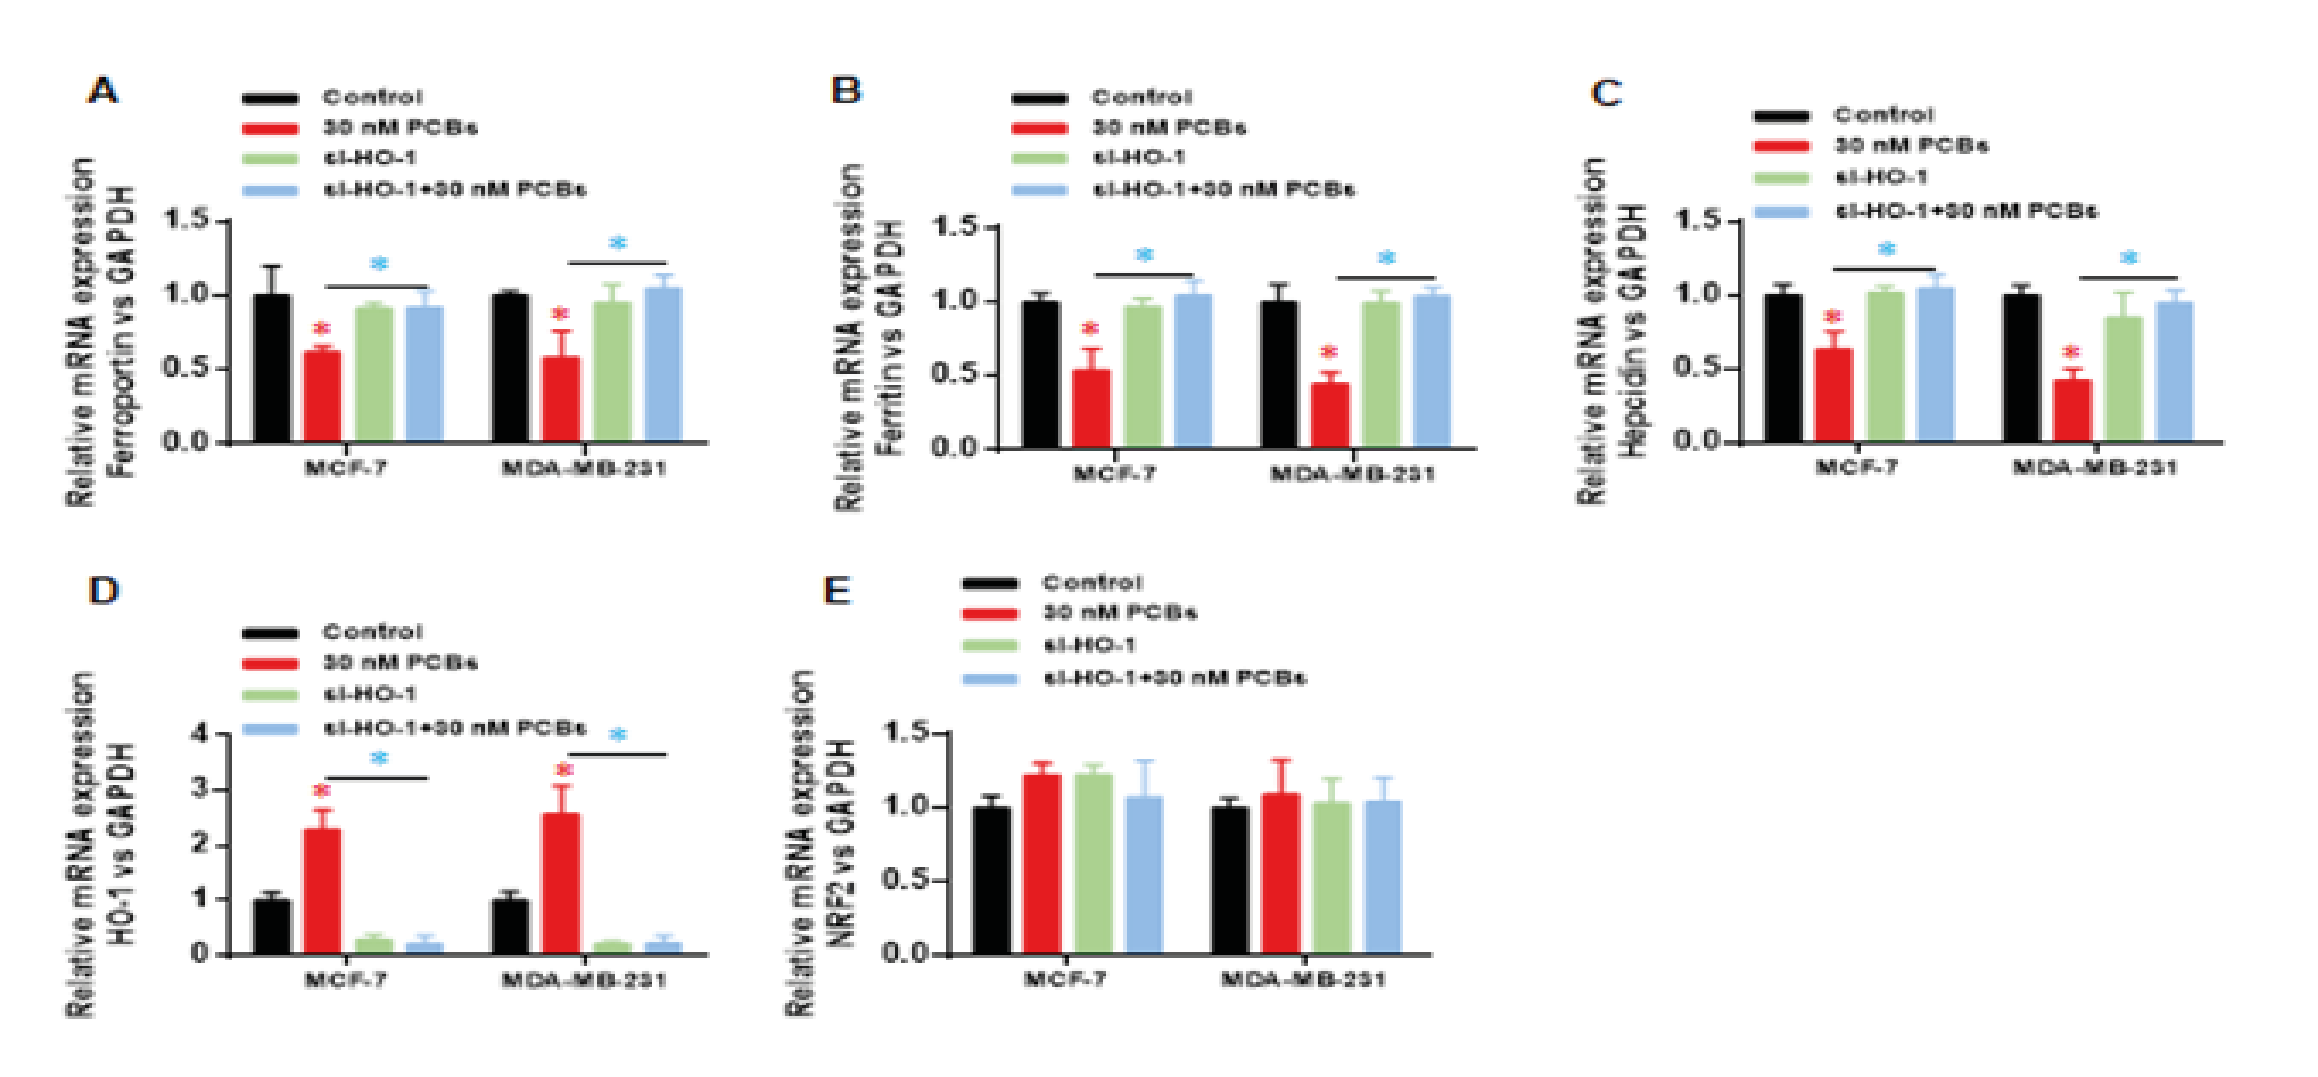
Figure 4: HO-1 silence recovered the damage of PCB exposure on iron metabolism related genes. Real-time PCR was used to evaluate the mRNA expression of iron metabolism associated genes: (A) ferrportin, (B) ferritin, (C) hepcidin. (D) HO-1 mRNA expression. (E) Nrf2 mRNA expression.
Data represent mean ± SD; n = 3 in each group. * p < 0.05 (Red: Control vs PCB; Blue: PCB+si-HO-1 vs PCB)
HO-1 Silence Attenuated the Oxidative Damage from PCB Exposure
The intracellular ROS intensity was analyzed, and as expected, PCB exposure highly elevated the ROS level in two cells (p < 0.01 vs control) (Fig. 5A). Two groups of siRNA treatment kept a normal ROS level under the PCB stress (Fig. 5A), which suggests that the PCB induced ROS damage is mediated by HO-1 function. In line with ROS, MDA levels in two BC cell lines were dramatically upregulated (p < 0.01 vs control) (Fig. 5B), and this upregulation was abolished by HO-1 siRNA (Fig. 5B). Finally, Superoxide dismutase (SOD) is an antioxidant metalloenzyme that catalyzes the disproportionation of superoxide anion radicals and produces oxygen and hydrogen peroxide. We observed that SOD levels were decreased by PCB treatment (Fig. 5C), HO-1 silence significantly recovered the SOD levels in both cell lines (Fig. 5C). Together, HO-1 is necessary to mediate the oxidative damage from PCB exposure.
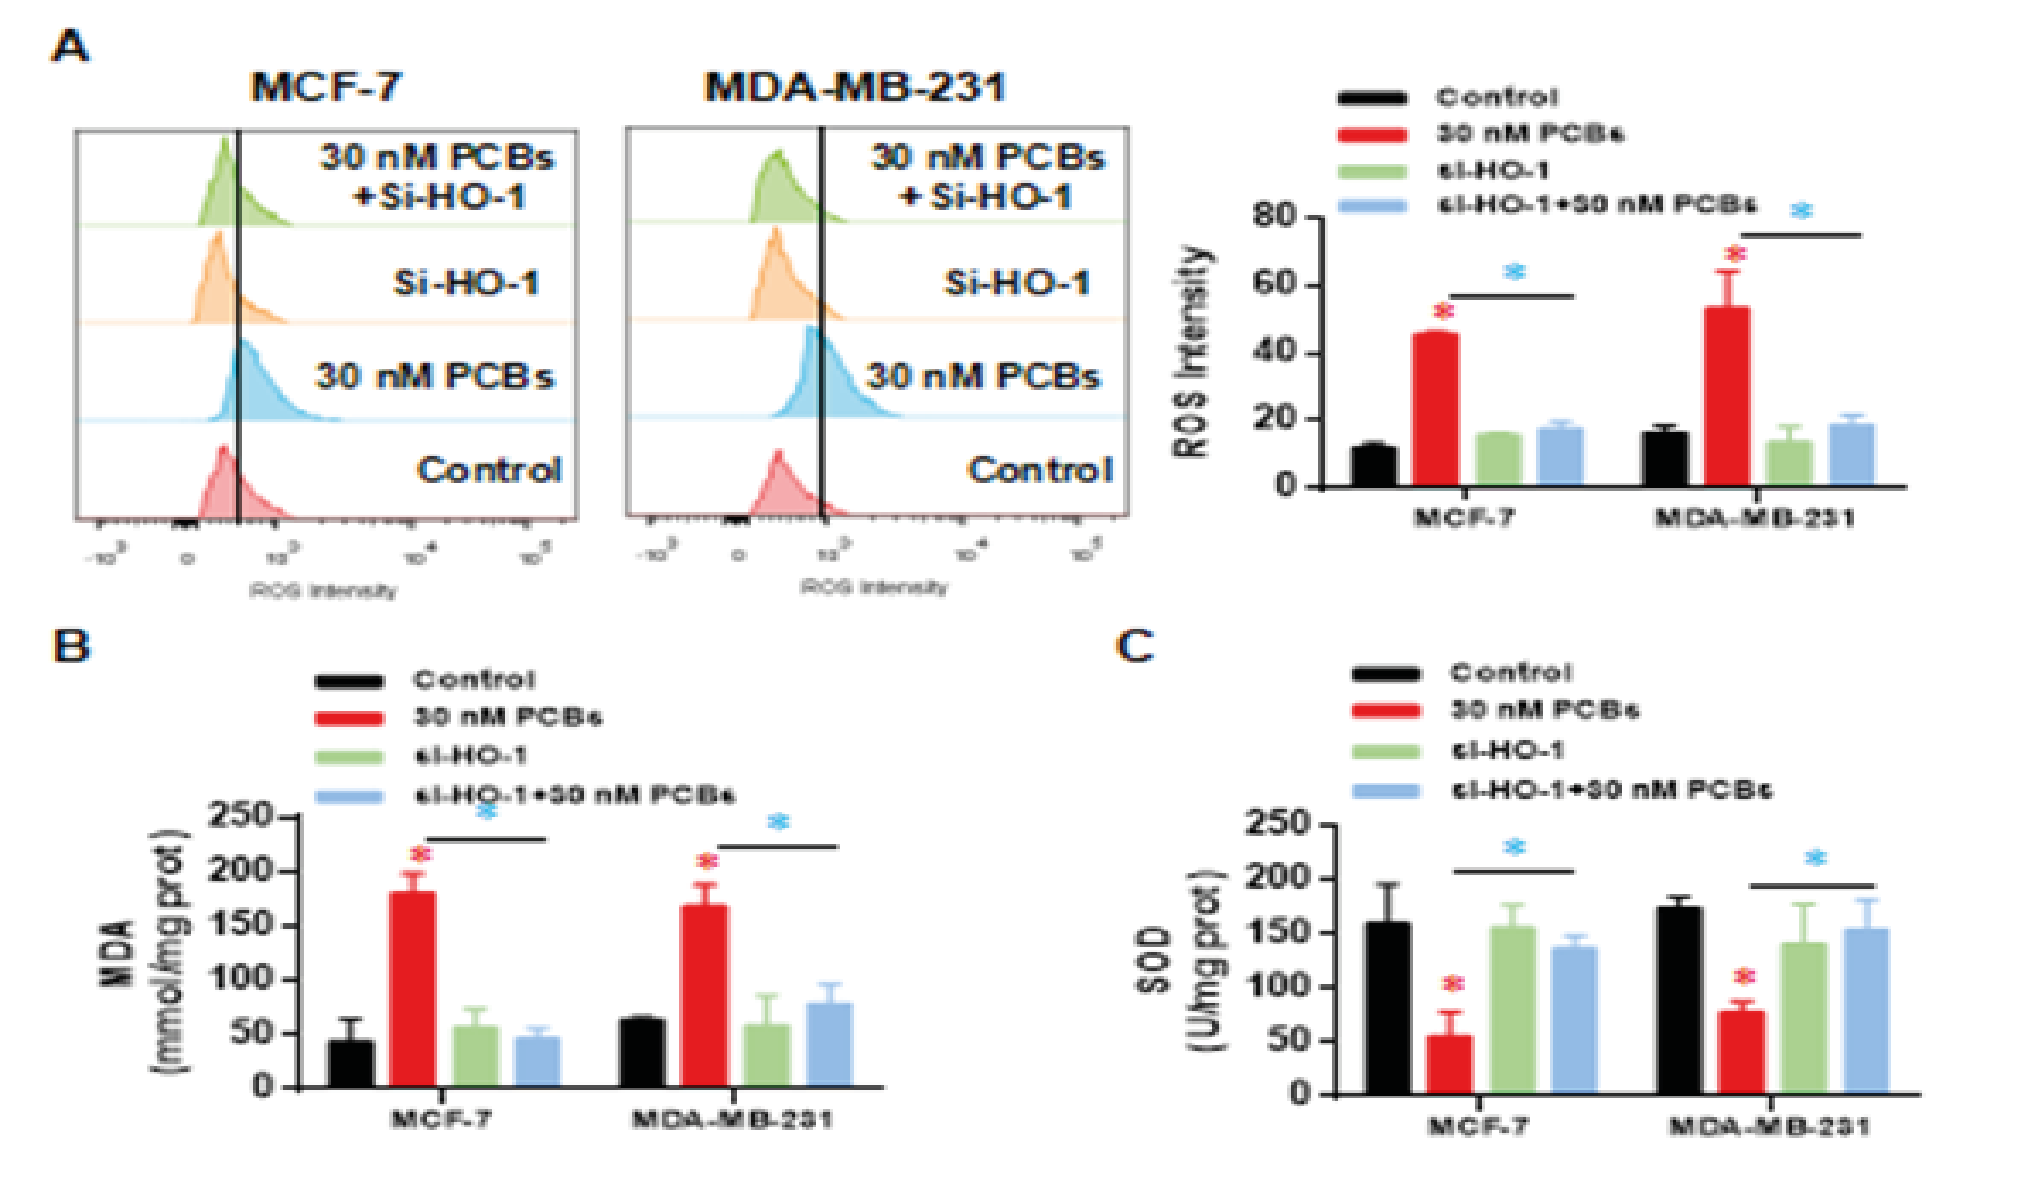
Figure 5: HO-1 silence attenuated the oxidative damage from PCB exposure. (A) The intracellular ROS intensity. (B) Malondialdehyde (MDA) levels. (C) Superoxide dismutase (SOD) levels.
Data represent mean ± SD; n = 3 in each group. * p < 0.05 (Red: Control vs PCB; Blue: PCB+si-HO-1 vs PCB).
In the present study, we probed the potential mechanism of PBC-exposure induced carcinogenic effect using BC cells in vitro. Briefly, PCB promoted cell proliferation, migration, and invasion in BC cell lines, and HO-1 were necessary for these effects. Abnormal expression of iron metabolism related genes and oxidative damage were caused by PCB exposure, which were also mediated by HO-1. This study, for the first time, highlights that the PCB/HO-1/iron-metabolism axis may participate in BC development.
We noticed that PCBs significantly increased the percentage of cells in G2/M phase and enhanced the migration/invasion ability of BC cells in vitro. This is consistent with previous reports [22, 23]. In epidemiological surveys, the association between PCB exposure and BC development has been noticed in different works [10, 24, 25]. Moreover, higher concentrations of PCBs in breast adipose tissue are associated with higher tumor malignancy and poorer prognosis in BC patients [23, 26, 27]. A study in US reported that the highest PCB174 tertile was associated with an increase in all-cause and breast cancer-specific mortalities within 5 years and 15 years [12]. However, very few studies have clearly revealed deep molecular mechanisms. We here demonstrated that HO-1 plays an essential role in PCB induced carcinogenesis. A similar research showed that combination of chlorogenic acid and salvianolic acid B can protect against PCB-induced oxidative stress through Nrf2 signaling, during which HO-1 was enhanced, as well as SOD, GSH and Nrf2 [28]. This work pointed out that Nrf2 regulates the cyto-protective response by up-regulating the expression of antioxidant genes. However, they showed an opposite role of HO-1 to our findings.
HO-1 belongs to the heme oxygenase family and catalyzes the degradation of heme. It is a membrane-bound enzyme that cleaves the heme ring to produce bilverdin, iron and carbon monoxide. Biliverdin is subsequently converted to bilirubin by biliverdin reductase. We proposed that HO-1 might participate in the damage from iron overload and subsequently BC development. Published data have indicated that HO-1 is positively correlated with inflammatory and excess iron. The high-heme diet induces significant increase of HO-1 expression [18]. Under hepatitis C virus infection, iron overload also up-regulates HO-1 expression [29]. In brain, sustained up-regulation of HO-1 in astrocytes promotes pathological iron deposition and oxidative mitochondrial damage characteristic of Alzheimer's disease-affected neural tissues [20]. In human obesity researches, HMOX1 was regarded an important marker of iron excess-induced adipose tissue dysfunction and metabolic disturbances [21]. In iron metabolic balance, hepcidin serves a vital role [30, 31], and its activity is mediated by the receptor ferroportin when transmitting the iron metabolism signals [32]. The hepcidin-ferroportin signal inhibits iron metabolism by reducing the release of intracellular free iron and its absorption in the duodenum [33, 34]. Also, the hepcidin-ferroportin axis can regulate tumor growth and metastasis [35, 36], that the enhanced signaling may attenuate tumor growth [35]. Our results suggested not only that iron disorder is sufficient to increase HO-1 expression, but also that HO-1 is necessary for signaling transduction of iron disorder to carcinogenesis, during which iron metabolism related genes are involved at the downstream of HO-1.
In conclusion, the carcinogenic effect of PCBs depends on the presence of HO-1 and is associated with the iron metabolism related factors. Silence of HO-1 can suppress the oxidative stress, recover the expression of iron metabolism members, and attenuate the in-vitro carcinogenic activity of PCBs.
The authors declare no competing interests.
The data that support the findings of this study are available from the corresponding author upon reasonable reguest.
This research was supported by grants from the National Natural Science Foundation of China (Grant No.: 21577106), Weihai Key Laboratory of Autoimmune Immunology (Grant No.: 2017GGH11), Weihai Genetic Testing Platform (Grant No.: 2015GNS047-06).
- Ali, I (2016) Exposure to polychlorinated biphenyls and prostate cancer: population-based prospective cohort and experimental studies. Carcinogenesis 37: 1144-1151. [Crossref]
- Haslam, A (2016) Polychlorinated biphenyls and omega-3 fatty acid exposure from fish consumption, and thyroid cancer among New York anglers. J Environ Sci (China) 41: 270-277. [Crossref]
- Gadalla, S.M., G. Andreotti (2015) Polychlorinated Biphenyls and Cancer: Are Telomeres to Blame? EBioMedicine 2: 1856-1857. [Crossref]
- Zani, C (2013) Polychlorinated biphenyls and cancer: an epidemiological assessment. J Environ Sci Health C Environ Carcinog Ecotoxicol Rev 31: 99-144. [Crossref]
- El Majidi, N., M. Bouchard., G. Carrier (2014) Systematic analysis of the relationship between standardized biological levels of polychlorinated biphenyls and thyroid function in pregnant women and newborns. Chemosphere 98: 1-17. [Crossref]
- Todaka, T (2011) Concentrations of polychlorinated dibenzo-p-dioxins, polychlorinated dibenzofurans, and polychlorinated biphenyls in blood and breast milk collected from pregnant women in Sapporo City, Japan. Chemosphere 85: 1694-1700. [Crossref]
- Cao, L.L (2011) Relationship between serum concentrations of polychlorinated biphenyls and organochlorine pesticides and dietary habits of pregnant women in Shanghai. Sci Total Environ 409: 2997-3002. [Crossref]
- Sharma, R (2019) Breast cancer incidence, mortality and mortality-to-incidence ratio (MIR) are associated with human development, 1990-2016: evidence from Global Burden of Disease Study 2016. Breast Cancer 26: 428-445. [Crossref]
- Tao, L (2019) Breast Cancer Mortality in Older and Younger Patients in California. Cancer Epidemiol Biomarkers Prev 28: 303-310. [Crossref]
- He, Y (2017) Association of breast adipose tissue levels of polychlorinated biphenyls and breast cancer development in women from Chaoshan, China. Environ Sci Pollut Res Int 24: 4778-4790. [Crossref]
- Parada, H., Jr (2016) Polychlorinated biphenyls and their association with survival following breast cancer. Eur J Cancer 56: 21-30. [Crossref]
- Leng, L (2016) Polychlorinated biphenyls and breast cancer: A congener-specific meta-analysis. Environ Int 88: 133-141. [Crossref]
- Liu, S., S. Li., Y. Du (2010) Polychlorinated biphenyls (PCBs) enhance metastatic properties of breast cancer cells by activating Rho-associated kinase (ROCK). PLoS One 5: e11272. [Crossref]
- Qian, Y (2015) Polychlorinated biphenyls (PCBs) inhibit hepcidin expression through an estrogen-like effect associated with disordered systemic iron homeostasis. Chem Res Toxicol 28: 629-640. [Crossref]
- Lipinski, P (2014) [Heme metabolism as an integral part of iron homeostasis]. Postepy Hig Med Dosw (Online) 68: 557-570. [Crossref]
- Wagner, K.R (2003) Heme and iron metabolism: role in cerebral hemorrhage. J Cereb Blood Flow Metab 23: 629-652. [Crossref]
- Furuyama, K., S. Sassa (2003) [Heme biosynthesis and iron metabolism]. Seikagaku 75: 179-186.
- Fillebeen, C (2015) Mice are poor heme absorbers and do not require intestinal Hmox1 for dietary heme iron assimilation. Haematologica 100: e334-e377. [Crossref]
- Chang, L.C (2016) The Ratio of Hmox1/Nrf2 mRNA Level in the Tumor Tissue Is a Predictor of Distant Metastasis in Colorectal Cancer. Dis Markers 8143465. [Crossref]
- Song, W (2012) Unregulated brain iron deposition in transgenic mice over-expressing HMOX1 in the astrocytic compartment. J Neurochem 123: 325-336. [Crossref]
- Moreno-Navarrete, J.M (2017) HMOX1 as a marker of iron excess-induced adipose tissue dysfunction, affecting glucose uptake and respiratory capacity in human adipocytes. Diabetologia 60: 915-926. [Crossref]
- Lee, Donna W (2006) Heme-oxygenase-1 promotes polychlorinated biphenyl mixture aroclor 1254-induced oxidative stress and dopaminergic cell injury. Toxicol Sci 90: 159-167. [Crossref]
- Brody, J.G (2007) Environmental pollutants and breast cancer: epidemiologic studies. Cancer 109: 2667-2711. [Crossref]
- Gray, J.M (2017) State of the evidence 2017: an update on the connection between breast cancer and the environment. Environ Health 16: 94. [Crossref]
- Spink, B.C (2002) Induction of cytochrome P450 1B1 in MDA-MB-231 human breast cancer cells by non-ortho-substituted polychlorinated biphenyls. Toxicol In Vitro 16: 695-704. [Crossref]
- Negri, E (2003) Environmental exposure to polychlorinated biphenyls (PCBs) and breast cancer: a systematic review of the epidemiological evidence. Eur J Cancer Prev 12: 509-516. [Crossref]
- Aronson, K.J (2000) Breast adipose tissue concentrations of polychlorinated biphenyls and other organochlorines and breast cancer risk. Cancer Epidemiol Biomarkers Prev 9: 55-63. [Crossref]
- Woolcott, C.G (2001) Organochlorines and breast cancer risk by receptor status, tumor size, and grade (Canada). Cancer Causes Control 12: 395-404. [Crossref]
- Chen, L (2016) Combination of chlorogenic acid and salvianolic acid B protects against polychlorinated biphenyls-induced oxidative stress through Nrf2. Environ Toxicol Pharmacol, 46: 255-263. [Crossref]
- Hou, W.H (2009) Iron increases HMOX1 and decreases hepatitis C viral expression in HCV-expressing cells. World J Gastroenterol 15: 4499-4510. [Crossref]
- Peslova, G (2009) Hepcidin, the hormone of iron metabolism, is bound specifically to alpha-2-macroglobulin in blood. Blood 113: 6225-6236. [Crossref]
- Lane, D.J., M.L. Huang., D.R. Richardson (2013) Hepcidin show some self-control! How the hormone of iron metabolism regulates its own expression. Biochem J 452: e3-e5. [Crossref]
- Jiang, X.F (2017) Coordination of Bactericidal and Iron Regulatory Functions of Hepcidin in Innate Antimicrobial Immunity in a Zebrafish Model. Sci Rep 7: 4265. [Crossref]
- Anderson, G.J., D.M. Frazer (2006) Iron metabolism meets signal transduction. Nat Genet 38: 503-504. [Crossref]
- Nemeth, E., T. Ganz (2009) The role of hepcidin in iron metabolism. Acta Haematol 122: 78-86. [Crossref]
- Pinnix, Z.K (2010) Ferroportin and iron regulation in breast cancer progression and prognosis. Sci Transl Med 2: 43-56. [Crossref]
- Xue, D (2016) Nuclear transcription factor Nrf2 suppresses prostate cancer cells growth and migration through upregulating ferroportin. Oncotarget 7: 78804-78812. [Crossref]