In this paper, the author described his two years research results, from 5/5/2018 through 5/29/2020, to identify a neural communication model between the brain’s cerebral cortex and certain internal organs such as the stomach, liver, and pancreas. He researched the postprandial plasma glucose (PPG) production amount at different timing via investigation of waveform differences between pan-fried egg, solid meal, and egg drop soup, liquid meal.
In Reference 1, the author has described partial results of his previous research work from 9/25/2019 through 2/11/2020 regarding the same subject using ~30 meals data of both egg drop soup and pan-fried egg [1]. Now, near the end of May of 2020, he has collected more than twice the amount of data from identical food material and cooking method, i.e. 69 of liquid food (egg drop soup) and 66 solid food (pan-fried egg). In addition, he has modified his analysis software to be able to present these glucose data in the Candlestick chart [2, 3]. Through the Candlestick chart, the different PPG amounts at different time instants between liquid food and solid food become far more obvious.
He has collected his glucose data via a continuous glucose monitor (CGM) sensor device from 5/5/2018 through 5/29/2020 at ~76.5 glucose data per day. For these ~2 years (755 days) period, he has collected a total of 57,765 glucose data. After the first bite of his meal, he measured his PPG data every 15 minutes for a period of three hours (180 minutes). He focused on investigating the relationships between different food inputs such as meal nutritional contents, cooking methods, physical phases and different glucose outputs, i.e. PPG “waveforms” (post-meal glucose “curves”). When he observed that different physical phenomenon of glucose waves from liquid food and solid food, he wondered why two different cooking meals would end up with two varying PPG waveforms with identical food nutritional ingredients input. Most of his medical associates in the fields of internal medicine and food nutrition have mentioned that food nutritional components, particularly carbohydrates and sugar amount, and exercise influence PPG values. Therefore, he decided to conduct an experiment of eating the same food ingredients but with two different cooking methods. It should be noted that he has kept the intensity and duration of his post-meal exercise at the same level.
By 2/11/2020 with ~30 meals for each category, liquid and solid, he discovered the vast differences existed between these two types of meals. At that moment, he came up with a neural communication hypothesis between the brain and certain internal organs via our nervous system. He then tried to verify this neural communication model with the path of “sending message from stomach to brain and then forwarding feedback message to both liver and pancreas” which determines our PPG production amount at different time instance by using a bigger experimental database and more mathematical tools.
On 5/29/2020, his friend, Dr. Deborah Zelinsky, a research scientist and a clinical doctor, who specializes in the area of interaction among the ear, eye, and brain, forwarded him an article [4].
Here is an Excerpt:
Published May 18 in the Proceedings of the National Academy of Sciences, an important world first, a study co-authored by Dr. Levinthal and Dr. Peter Strick, both from the Pitt School of Medicine, has explained what parts of the brain’s cerebral cortex influence stomach function and how it can impact health. Dr. Peter Strick is a world leader in establishing evidence that internal organs are strongly modulated at the highest levels by the cerebral cortex. It’s been traditional in biology and medicine that the internal organs are self-regulatory through the autonomic nervous system, largely independent of higher brain regions. Dr. Strick’s previous research, for instance, also showed that similar areas of the cerebral cortex also control kidney and adrenal function. That course of research now could extend to “the heart, liver and pancreas to discover more about how the brain coordinates control of internal organs,” said Mr. Sterling who holds a Ph.D. in neuroscience. When it comes to trusting your gut, it already is well-established that the stomach and gut send “ascending” signals to the brain in a way that influences brain function. But the study has found that the “central nervous system both influences and is influenced by the gastrointestinal system.” What people haven’t understood to date, Dr. Strick said, is that the brain also has “descending influences on the stomach” with various parts of the brain involved in that signaling, including those areas that control movement and emotions. Those areas control the stomach “as directly as cortical control of movement. These are not trivial influences.”
On May 27, 2020, David Templeton, a writer for the Pittsburgh Post-Gazette presented this excellent medical discovery report. It described exactly what the author, for almost a year, guessed and felt about the neural communication model between brain and other internal organs. The author, by training, is a mathematician, physicist, and engineer, but not a medical doctor or a neuroscientist. However, for the period of 9/15/2019 to 2/11/2020, he discovered and proved these “ascending” messages from the stomach to brain regarding food entry, and also “descending” messages from the brain to liver and pancreas regarding glucose production. He verified these observations via his examination of specific physical phenomena, establishment of a few mathematical models, and verification by big data analytics. Last year, he was using selective words, such as hypotheses, guess, and might be, to describe his findings, but now he has found the support and proof from the work by other neuroscientists and brain experts [4].
Since he has already published a few articles along this line of thought in early 2020, using various food and glucose data, he will forgo some explanations and go directly into the same conclusion based on a relatively “bigger” size of experimental data.
In this particular study, he has focused on the following two specific meal categories which involved eggs only. The main difference between these two “egg alone” meal categories is the cooking method. From Figure 1, one large egg contains mainly proteins (6.3g) and fat (5g), and small amount of carbohydrates (0.38g) and sugar (0.38g). It should be noted that he occasionally takes two eggs, adds some chopped spring onions for flavor, or adds in very small amount of seaweed for iodine.
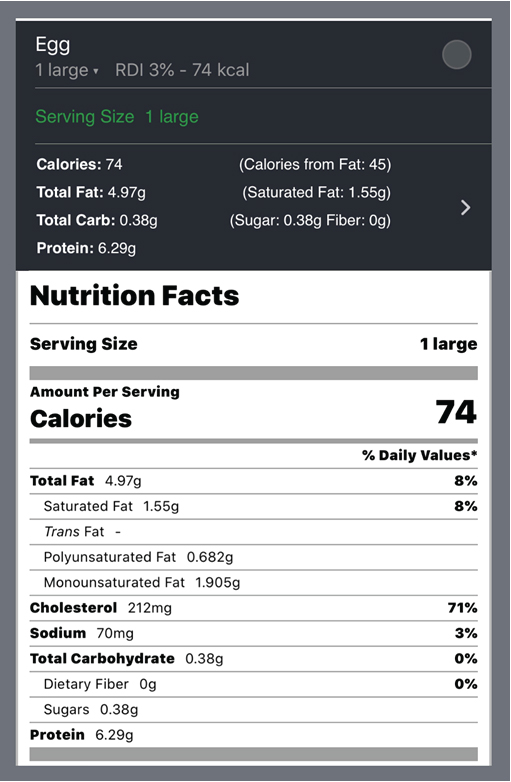
Figure 1. Nutritional Ingredients of one Large Egg
In his first category, he ate 66 pan-fried egg “solid shape” without any other contents with carbs/sugar ingredients. This “solid phase” of pan-fried eggs has an average carbs/sugar amount of 3.3 grams. His average post-meal walking steps are 4,817. His average solid finger PPG is 112 mg/dL and solid sensor PPG is 133 mg/dL (19% higher than finger and 21 mg/dL of PPG difference).
In his second category, he ate 69 egg drop soup meals (pouring mixed eggs into boiling hot water to slowly make thin-layered egg “clouds or sheets” in the soup). This “liquid phase” of egg drop soup has the exact same type and amount of nutritional ingredients as the pan-fried “solid phase” egg meals, which contains only protein and fat without any significant carbs/sugar. This “liquid phase” egg drop soup has an average carbs/sugar amount of 2.1 grams. His average post-meal walking steps are 4,331. His average liquid finger PPG is 108 mg/dL and liquid sensor PPG is 118 mg/dL (9% higher than finger and 10 mg/dL of PPG difference).
It should be noted that his personal target of post-meal walking is 4,000 steps. Each 1,000 post-meal walking steps would decrease PPG value by approximately 5 mg/dL. Since his post-meal exercise amounts for these two food categories are almost equal, he can then mainly focus on the influence from food on his PPG values. In this particular study, since food nutritional ingredients are almost identical, the cooking methods are completely different. Therefore, he decided to focus on his cooking method which resulted into two different “physical phases”, i.e. liquid versus solid. His first exposure to physics and chemistry occurred in his first year of middle school, at age 10. He was taught to remember three states of matter: solid, liquid, and gas. After 62 years, this basic knowledge of physics came into mind to help him discover these neurology related phenomenon.
Figure 2 shows the detailed data table of this particular study. Figures 3 and 4 illustrate PPG 3-hours waveforms with their respective candlestick charts of liquid food and solid food.
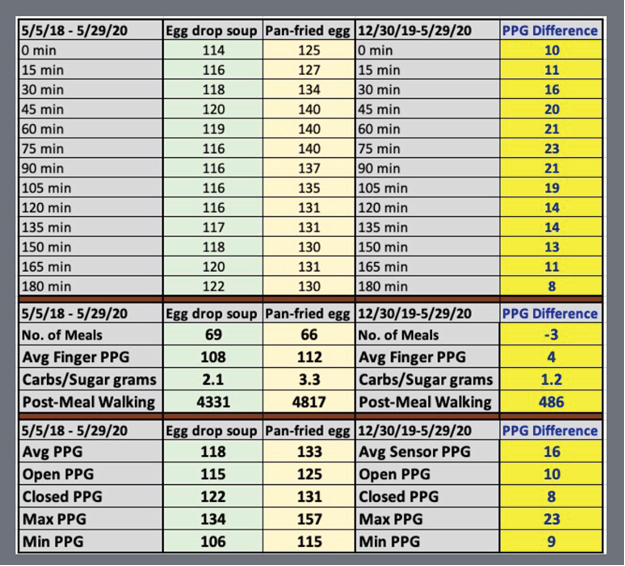
Figure 2. Data Table
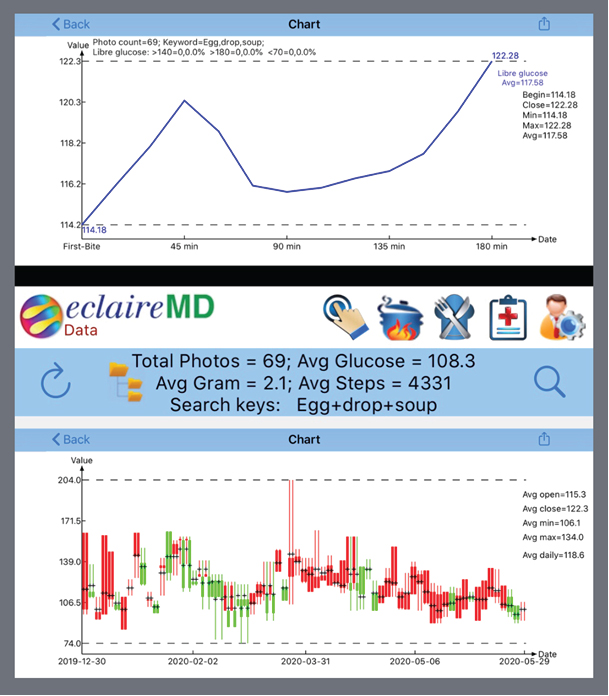
Figure 3. Detailed Sensor PPG and Candlestick Chart of Egg Drop Soup (Liquid Soup)
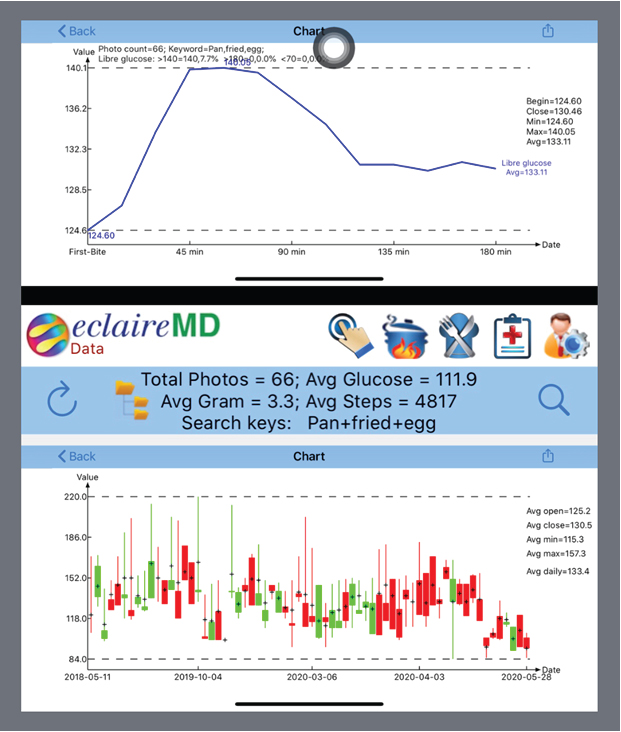
Figure 4. Detailed Sensor PPG and Candlestick Chart of Pan-Fried Egg (Solid Food)
Figure 5 is the most important figure in this article. The author put two waveforms and candlesticks of both liquid food and solid food together in the same diagram. The significant PPG differences between these two food types can be easily observed. The question here is why they look so different? Both foods’ physical appearances have the same nutritional ingredient inputs; however, their different cooking methods resulted into differing physical states, liquid or solid. Maybe the message (or signal) ascending from the stomach to the cerebral cortex is not food ingredients, but rather the food’s physical state. Therefore, the brain misinterprets soup as an equivalent to a cup of coffee or tea and then the brain issues a descending message to the liver for releasing a lesser amount of glucose.
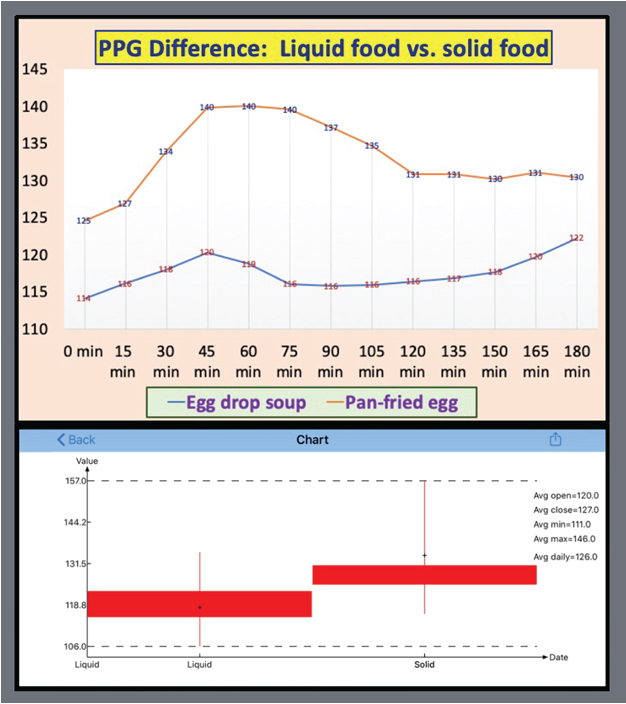
Figure 5. PPG Waveforms & Candlesticks of Liquid Food and Solid Food
Figure 6 shows the PPG differences between liquid and solid at each and every 15-minutes interval. It is obvious that the distinctions between solid and liquid are located within the range of 8 mg/dL (at 180-minutes) and 23 mg/dL (at 75-minutes) with an average PPG difference of 16 mg/dL. These differences do not seem too big because of the data collected are from the recent two-year period of 5/5/2018 to 5/29/2020. During this period, his diabetes conditions were already under control without taking any medication. This means that these results are strictly the internal biological outcomes by his stringent lifestyle management program and without any external medication’s chemical intervention. He wonders what would have happened in 2010 while his glucose reached to 280 mg/dL and also took three different kind of medications with full dosages?
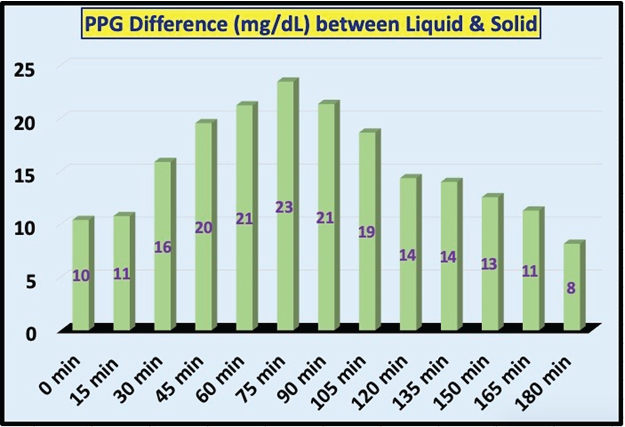
Figure 6. Sensor PPG Amount Differences at Each Time Instance
Figures 7 and 8 show PPG results using candlestick chart technique [2, 3]. Each chart has five key characteristics, i.e. opening glucose at 0-minute, close glucose at 180-minutes, maximum glucose usually around 45-minutes to 75-minutes, minimum glucose usually around 120-minutes, and average glucose over a period of 180 minutes. The author has also observed from his 2,265 meals and 29,445 PPG data for the past 755 days. The first evidence is that the stomach takes about 10-15 minutes to inform the food entry message to the brain. The second evidence is that, for liquid food, it takes about 45 minutes for the liver to release glucose at its peak, and for solid food, it takes about 45-75 minutes for liver to release glucose its peak.
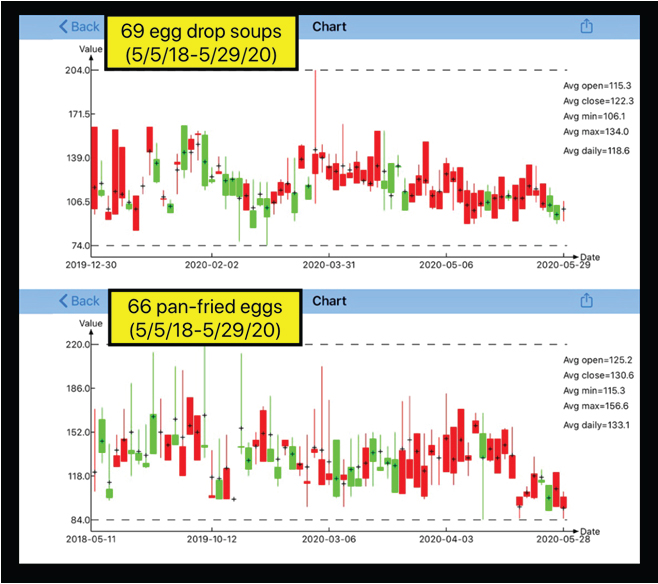
Figure 7. Candlestick Chart of Sensor PPG Amount between Liquid Food and Solid Food
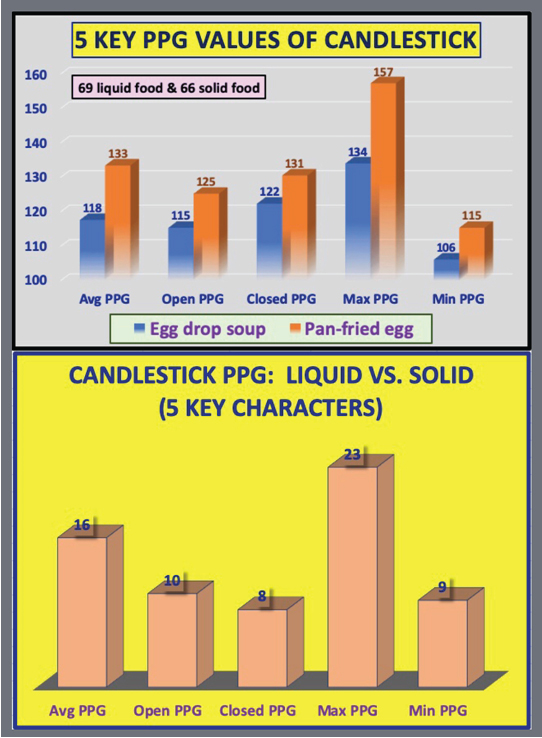
Figure 8. 5 Key PPG Values & Differences from Candlestick Chart between Liquid Food and Solid Food
It is interesting to point out that some physicians and nurses provide advice to diabetes patients about PPG measuring time. They inform patients to measure their finger-piercing PPG value at two-hours after their meal because it would be the PPG’s peak time. Actually, based on the author’s big data analysis, he proved quite an opposite finding. The peak time is usually around one hour and lowest time is around two hours after the first bite of meal.
When the author could not locate a satisfactory explanation from professional knowledge of either food nutrition or clinical internal medicine, he started to delve deeper into the source of this problem: “the creation of glucose”. He realized that glucose is not directly converted from food nutritional ingredients. Instead, the glucose was directly produced by the liver. Of course, the human body and all of its internal organs, including the stomach, liver, and pancreas are depended on the food supply for their needed energy.
Therefore, he came up with his first hypothesis that the glucose difference is probably due to the physical phase of consumed food, such as liquid or solid, that is decided by the brain.
Furthermore, the author has learned three basic facts from his past 9-years of medical research work. First, 70% of our daily energy intake is consumed by our brain and nervous system. Second, the brain is the only internal organ which has the power of cognition, judgement, information processing, decision making, and marching order issuance. Third, all of our internal organs are working closely together but under the orders from a single command center which is the brain.
Based on above acquired biomedical knowledge, the author further developed his second hypothesis. When one particular food type enters into gastrointestinal system, stomach will immediately send a message (or a signal) to inform the brain about the arrival of food and its physical phase. After receiving this input signal from the stomach, the brain will then start to process information, make proper judgements, and then issue its feedback message (descend a marching order) to the liver regarding how much glucose amount should be produced or released at what time instant, as well as within what time frame to reach to the peak of glucose. At the same time, the brain will also inform the pancreas regarding how much insulin should be produced or released when an excessive amount of glucose has been produced or released by the liver. However, for severe diabetes patients whose pancreatic beta cells were damaged to different degrees, therefore each patient’s insulin capabilities and qualities (i.e. production quantity and insulin resistance) will not be the same to influence the final PPG reading.
These two particular hypotheses support the author’s view on how the neural communication model among the cerebral cortex of the brain, stomach, liver, and pancreas regarding PPG production during the 180 minutes period after the first bite of our meal.
Perhaps the difference in PPG readings may also be affected by the absorption factors of chyme, which is a semiliquid digested food that passes from the stomach to small intestine, consisting of gastric juices and some leftover food. Chyme from a solid meal is relatively dense and may take more time passing through the absorptive surface area of the small intestine, while chyme from a liquid meal is mostly liquid and may pass through the absorptive surface more quickly. The absorption speed of chyme indeed affects the timing of peak PPG, for example, 45 minutes for liquid meals and 75 minutes for solid meals. But, the two peak PPG values of liquid and solid should be at an equal amount given that these two meals have identical food nutritional ingredients. On the other hand, based on his careful physical observations of peak PPG timing and amount together, the author believes that these differences are partially due to the “absorption factor” of chyme. Another part of the reason is that the ascending message of food arrival and the physical phases of food (chyme is a kind of “physical phase) of his hypothetical neural communication model between the stomach and the brain causes the significant difference on the two peak PPG values (116 mg/dL for liquid meals and 140 mg/dL for solid meals).
From a neuro-scientific point of view, the author has utilized his developed math-physical medicine methodology (MPM) and his learned biomedical knowledge to “trick” the cerebral cortex of brain into producing or releasing a “less” amount of PPG, without altering or suffering the needed food nutritional balance. If this idea works, by just changing the cooking method, it can then help many T2D patients to lower both their peak PPG and average PPG levels without reducing or changing their food nutritional contents. Of course, T2D patients must avoid overeating food with high carbohydrates and sugar contents at all times.
By sharing his research findings with other fellow medical research scientists, he hopes that they can provide some better explanations, more proof, or further justifications by using a different or traditional research methodology, such as the biochemical medicine (BCM) approach.
- Hsu Gerald eclaireMD Foundation, USA. March 2020. No. 229: Hypothesis on glucose production com-munication model between the brain and internal organs via investigating the PPG values of pan-fried solid egg meal vs. Egg drop liquid soup meal.
- Hsu Gerald C eclaireMD Foundation, USA. May 2020. No. 76: Using Candlestick Charting Techniques to Investigate Glucose Behaviours (GH-Method: Math-Physical Medicine).
- Hsu Gerald C eclaireMD Foundation, USA. May 2020. No. 261: Comparison study of PPG characteristics from candlestick model using GH-Method: Math-Physical Medicine.
- Templeton David (2020) Pittsburgh Post-Gazette, Pitt study shows brain and stomach connections are a two-way street.[Crossref]