In this paper, the author analyzed his 1,706 meals that was segregated into two major groups, five different eating places, and six nations, using waveform characteristics analysis and energy theory to understand the moving trend and pattern of glucose, as well as its associated energy level.
The author used a continuous glucose monitoring device (Sensor) applied to his upper left arm and has collected ~74 glucose data each day since 5/5/2018. In this particular analysis, he selected the entire Sensor period of 549 days (5/5/2018 - 11/4/2019) with 40,626 total glucose data, 1,706 PPG waveforms, 20,472 Sensor PPG data (12 data per meal) and 1,706 Finger PPG data. The main focus is using sensor data to examine their respective PPG waveforms (i.e. curves) in order to identify their physical characteristic differences among various eating places and nations. Finger PPG data are only used for comparison and reference purposes - not used for any calculations [1].
Each standard PPG waveform has an “open” glucose (0 minute, i.e. at first bite of meal), “peak” glucose (usually around 60-minutes), “120-minutes” glucose (similar to Finger PPG measurement time), and “180-minutes” glucose. He also calculated the “average” Sensor PPG data and their associated energy which would circulate within the blood flow in blood vessels reaching to every part of the internal organs, except hair. Each meal’s carbs/sugar intake amount and Finger PPG value are also measured and recorded. Post-meal walking steps are also documented, but not specifically mentioned in this case study. The above-mentioned process is a typical segmentation analysis of big data.
This study had two main purposes. The first one is to determine the glucose moving trend and pattern in detail and to validate his quantitative finding with those commonly accepted public knowledge about the importance of diet for diabetes control. The second purpose is to further identify and corroborate his previous hypothesis of the brain’s role in glucose production, particularly from the perspectives of physical observation and mathematical verification [2].
Meals Prominent Characters
During the period of 549 days (5/5/2018 -11/4/2019), his home cooking meals occupies 47% and dining-out meals are 53%. His meals from the supermarket’s prepared food are the worst kind with the highest glucose and associated energy. However, due to its exceptionally low 2% contribution ratio to total meals, this research section will try to omit the influences from the supermarket meals.
In the category of nations, his U.S. meals occupy 53% and meals outside the boundaries of the United States are 47%. However, his meals in Canada only contribute 1% of total meals, and all of Canada’s 16 meals are dining-out meals that make the averaged glucose and associated energy the highest. Therefore, this section will also try to omit the influences from Canadian meals.
He also analyzed the main characters of each sub-category and ranked them according to their respective glucose elevation and its associated energy level.
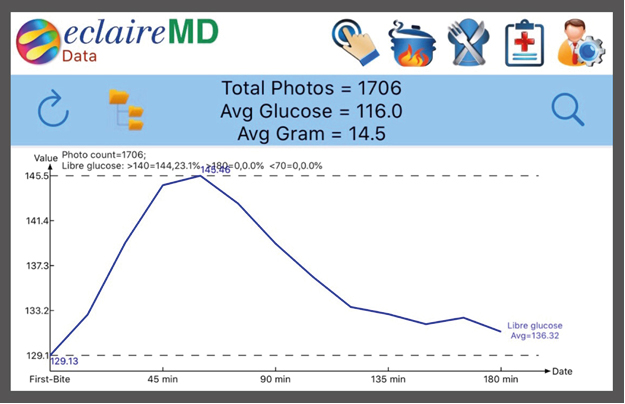
Figure 1. Overall PPG Waveform
Figure 1 shows his overall 1,706 meals PPG waveform with 14.5 grams of averaged carbs/sugar intake amount, 116 mg/dL of Finger PPG, and 136 mg/dL of Sensor PPG.
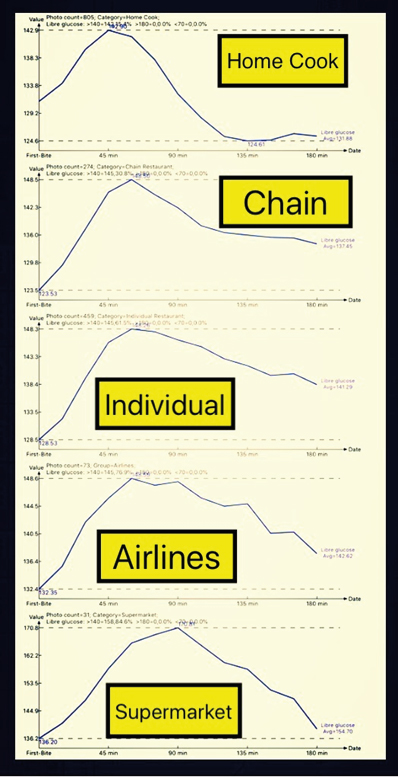
Figure 2. Sub-Category of Eating Places
After examining Figure 2, he has identified the following from eating places analysis:
(A-1) Home cooked food: It has the lowest glucose and energy due to the author’s thorough knowledge of food nutrition and his persistence on stringent diet control.
(A-2) Chain restaurant: He eats about 45% of his breakfasts at one particular chain restaurant. Due to economical reason to reduce the chain restaurant’s meal portion, it has the second lowest average glucose and energy.
(A-3) Individual restaurant: It has much higher carbs/sugar intake amount which also pushes its averaged glucose and energy higher.
(A-4) Airline: This meal sub-category includes airport food, VIP lounge food, and inflight food, which have quite high carbs/sugar intake amount (20.9 grams per meal) and the surrounding environments are quite difficult for post-meal exercise (e.g. walking). Therefore, it is the second worst sub-category next to the supermarket meals.
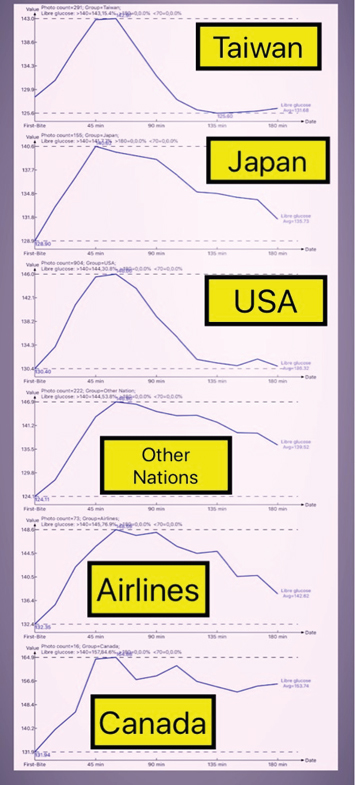
Figure 3. Sub-Category of Nations
After examining Figure 3, he has identified the following from nation’s analysis:
(B-1& B-2) Taiwan & Japan: These two combined nations contribute 26% of the total meals. The reason they have low glucose are the combined effect from mostly home cooking meals and convenient environment for post-meal walking.
(B-3) USA: It contributes 53% of the total meals and also is the most representative sub-category. Its excellent glucose and energy are due to mostly home cooking and convenient post-meal exercise environment.
(B-4) Other nation: The author has traveled through 15 nations during this past 18-month period. The sub-category of other nations has high glucose due to lack of facilities for home cooking (100% dinning-out) and less convenient or unfamiliar environments for post-meal walking exercise [3].
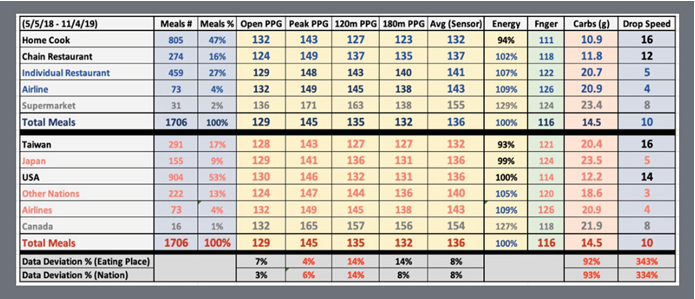
Figure 4. Calculation Table
The glucose control conclusions obtained from PPG prominent characters analysis are:
1. Sufficient knowledge of food nutrition, especially carbs/sugar
2. Persistent diet control and post-meal exercise
3. Avoid or reduce dining-out
Waveform characteristics Analysis:
Initially, he has defined two new “terms” below:
1. Data deviation% = (maximum data - minimum data) / (minimum data)
2. Glucose dropping speed = (peak glucose at ~60 minutes - glucose at 120 minutes) / one hour
From the bottom section of the “data deviation %” in Figure 4, peak glucose deviation is 4% to 6% which means PPG rises to its peak with very small difference among various sub-categories. Even the impact from carbs/sugar intake is negligible in the period from 0-minute to 60-minutes. However, the 120-minutes glucose deviation is 14% which means there is big differences of glucose between peak time (60-minutes) and 120-minutes. These bigger differences are mainly due to the impact from carbs/sugar intake as it starts to change the waveform slope and shape. For example, when he eats in individual restaurants or in other nations during his travel days as well as eating airlines meals, he consumes much higher amount of carbs/sugar. He noticed that the size of maximum carbs/sugar amount is almost double the size of minimum carbs/sugar amount. The glucose decreasing speed from the peak level to 120-minutes level has a deviation of >300%, from peak glucose of 143-149 mg/dL level dropping down to 120-minutes glucose of 127-145 mg/dL. These phenomena cause the maximum reduction speed of 16 mg/dL per hour
down to the minimum dropping speed of 3 mg/dL or 4 mg/dL per hour [4].
The conclusions obtained from the waveform characters analysis are threefold:
1. First, the peak glucose level is created mainly by the brain’s immediate reaction of food entry.
2. Second, the dropping speed between peak and 120-minutes depends on the amounts of the carbs/sugar intake and post-meal exercise along within the duration. These observations of glucose consumption are related to energy theory of diffusion speed of carbs/sugar intake amount.
3. Third, this excessive energy from high leftover glucose will cause damages to the internal organs.
This paper further enhanced the author’s findings in his presented or published medical research papers regarding excessive energy, brain neuroscience functions on both initial and follow-on glucose productions, and importance of diet and exercise on controlling excessive leftover glucose [5].
He applied his developed GH-Method: math-physical medicine methodology, including wave theory, energy theory,
waveform analysis, segmentation analysis, etc., to investigate the detailed phenomena and prominent characteristics of PPG waveforms. These findings will be extremely useful for T2D patients on their diabetes management and disease complications control.
- Hsu Gerald C (2018) Using Math-Physical Medicine to Control T2D via Metabolism Monitoring and Glucose Predictions. Adv Endo and Dia 1: 1-6. [Crossref]
- Hsu Gerald C (2018) Using Signal Processing Techniques to Predict PPG for T2D. J Diabetes Metab 3: 1-3. [Crossref]
- Hsu Gerald C (2018) Using Math-Physical Medicine and Artificial Intelligence Technology to Manage Lifestyle and Control Metabolic Conditions of T2D. Diabetes & its Complications 2: 1-7. [Crossref]
- Hsu Gerald C (2018) Using Math-Physical Medicine to Analyze Metabolism and Improve Health Conditions. Video presented at the meeting of the 3rd International Conference on Endocrinology and Metabolic Syndrome. Amsterdam, Netherlands. [Crossref]
- Hsu Gerald C (2018) Using Math-Physical Medicine to Study the Risk Probability of having a Heart Attack or Stroke Based on Three Approaches, Medical Conditions, Lifestyle Management Details, and Metabolic Index. EC Cardiology 5: 1-9. [Crossref]