In this study, an attempt is made to study the Sun on the basis of modern equipment and the latest advances in the study of solar neutrino fluxes. In particular, a neutrino telescope based on the ANRI effect is used. This made it possible to start the problem of the internal structure of the Sun within the framework of the model of a neutrino source of the central zone. The first results obtained from the flow pattern are in good agreement with the cavitation radiation neutrino model.
Sun; Neutrino Flux; Radiation Pattern; Neutrino Telescope; Cavitation Model of Neutrino Radiation
In fact, the role of traditional neutrino telescopes containing a huge mass of matter for single interactions with a solar neutrino flux cannot be taken into account in this study due to the constructive inapplicability of these devices for obtaining data on solar neutrinos and their sources. Accordingly, new physical effects and corresponding equipment are used for successful study.
A Neutrino Telescope Based on the ANRI Absorption Effect:
The existence of the effect of anomalous neutrino radioisotope (ANRI) absorption has been shown experimentally and the initial stage of work has already led to new results. For example, simplified and with a geophysical bias [1-4]. The spectrum of temporal variations in the activity of the Zabaikalskaya radioactive ore sample contains peaks that coincide with the periods of the Sun's own oscillations. The capture cross-section of a heavy radioactive deformed nucleus at the pre-decay moment increases and is capable of interacting with the flux of solar neutrinos modulated by the Sun's own oscillations. The spectrum of long-period oscillations of the Earth, exceeding its own, contains peaks that coincide in value with an accuracy of 1-3% with the peaks of the Sun's own oscillations. The mechanism of excitation of these oscillations is similar to the nature of the occurrence of variations in the activity of a radioactive ore sample. The discovered effects are included in the mechanisms of interaction of the Earth-Sun system and affect seismicity, and will make it possible to search for a natural nuclear reactor in the inner core of the Earth. Taking into account the applied and fundamental significance of the effect, as well as the need for careful repetition and verification of the results of primary studies, the authors methodically and technically repeated the first effective work, but at the same time, the registration of the ANRI effect was additionally duplicated by using a parallel recording channel operating on a different principle (the appearance of a thermal field in decay processes). Both methods: radiometric and thermal, their results coincided both with the data of the primary work and with each other. Thus, the existence of the ANRI effect has been absolutely reliably proved again [1]. This study actually draws a line under the primary study of the absorption effect, and is the exit of the applied study technology on a wide front of new prospecting works, taking into account or based on previous results [1-4]. Indeed, in the initial study, it was possible not only to register the solar neutrino flux, but also to record the spectrum of the Sun's own oscillations based on the modulated radio flux [1, 2]. Moreover, the actual neutrino detector based on the ANRI effect [5, 6] by the weight of the working radioactive substance did not exceed ~ 10 g, which is 1010 times less than the amount of the substance - specially purified water "Kamiokande"; the comparison of registration systems leads to an equally shocking surprise. Therefore, a comparison with the ICECUBE registration system in Antarctica is unnecessary. Such striking differences are explained by a 10 1030-fold increase in the cross section for neutrino capture by radioactive matter [5]. But the neutrino detector used on the basis of the ANRI effect, just like all the previous ones, is not able to point towards the neutrino source by turning any side of the structure, that is, it is necessary to focus on the source along the paths of interaction of neutrinos with the nuclei of the working substance. Without ANRI effect - for example, the Kamiokande system works. Therefore, to create authentic.
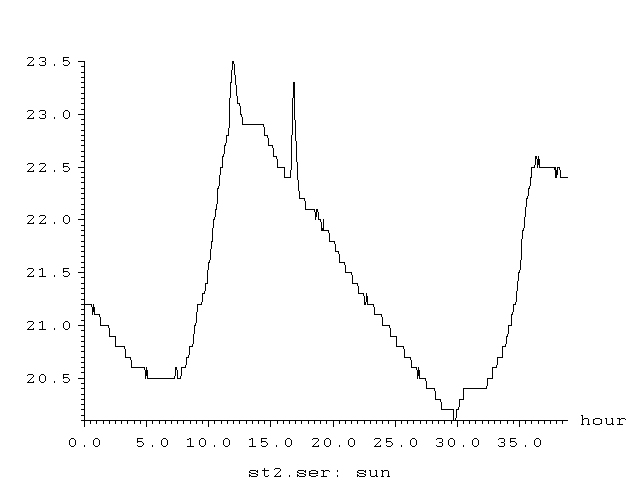
Figure 1: Recording of the observation of the passage of the solar disk (4-minute averaging). There are 2 peaks, one associated with the passage of the solar maximum (main peak), and the second, caused by a solar flare, which was recorded by the corresponding service (Fig. 2).
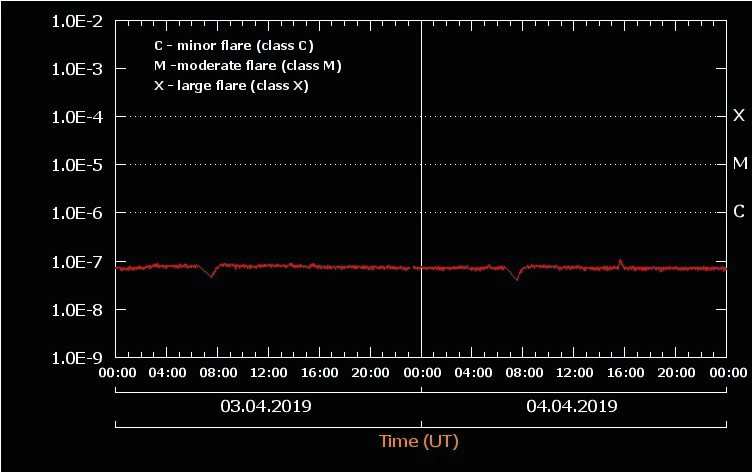
Figure 2: At 15h 52min 04.04. 19. The solar activity observation service registered a burst of activity on the sun corresponding to the second peak in Figure 1.
The results obtained make it possible to raise the question of a deeper study of the structure of the Sun as a source of neutrinos. That is, to find out the possibilities of analyzing a source based on the results of measurements of a neutrino telescope (NT) based on the ANRI- effect.
In [1-6] the results of measurements of neutrino fluxes from various sources, including from the Sun, are given (Fig. 3-5).
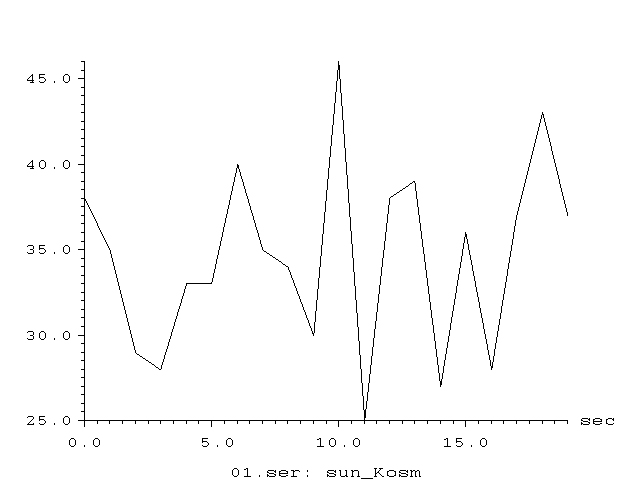
Figure 3:
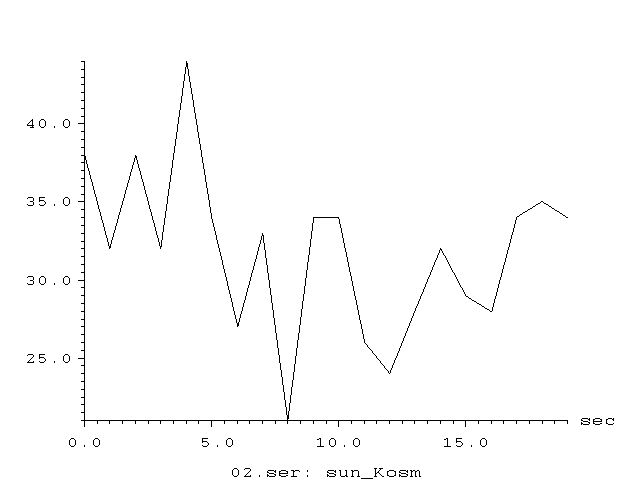
Figure 4:
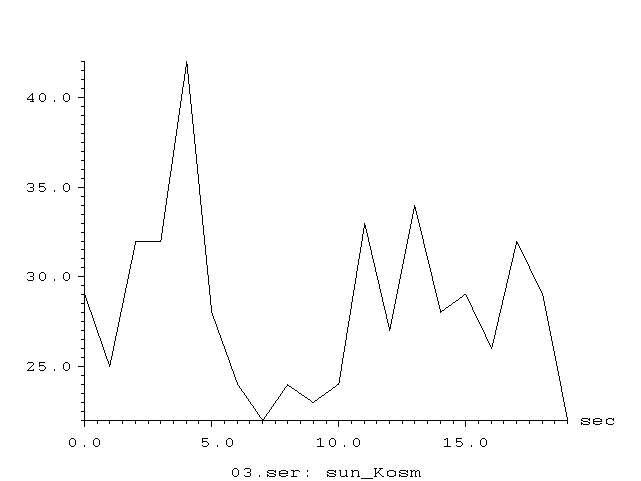
Figure 5:
Figures 3-5 show the graphs of the dependence of the flux density of particles emitted by the Sun and recorded NT based on the ANRI effect, when the solar disk passes through the telescope aperture. Signal registration time ~ 20 s [7].
As can be seen from the given graphs, the signal represents oscillations irregular in time and amplitude. In the section, the duration of which is ~ 20s. a series of peaks that are relatively short in time are observed, the amplitude of which fluctuates in a certain small interval. Let's try to make an assessment of the spatial characteristics of the emitter according to the presented graphs.
First of all, the observation time and the signal amplitude depend on the width of the main maximum of the radiation pattern (DP) of the receiving device - the NT telescope. The second parameter that determines the observation time and signal amplitude is the RP of the radiation source. In this case, the observation time and signal amplitude can be determined by the coherence of the source, that is, whether the emitter is a source of incoherent - diffuse radiation or a source of coherent (partial coherent) radiation. The width of the BP of the source can be determined from the signal shape, and the width of the telescope can be measured.
Measuring the directional diagram of the telescope. The layout of the elements of the experiment is shown in Fig. 6. Control sensor temperature = - 4C0. For the sensor of the neutrino telescope, 3d was used. Baikal ore U235, and in the telescope - tablets of thorium ore of weak radioactivity (no more than 20 microroentgens). Cs137 in a lead shell 1 cm thick was used as a neutrino source. In the decay reaction Cs137 = Ba137 + e- + ν with the release of neutrinos (the number of decays is 20000 / s). All decay products, except for neutrinos, were completely shielded by the shell of the Cs137 source.
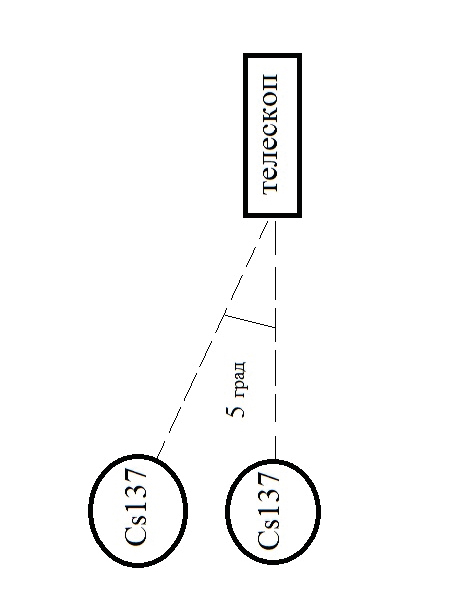
Figure 6: Telescope Directional Diagram Measurement Scheme
The DP was measured as follows: without a source, the receiver temperature was -3 С0, with the source turned on = -1.3 С0. With a shift of 5 angular degrees = -2.0 C0. With a shift of 10 angular degrees = - 3.0 C0. , i.e. as well as without a source. Thus, the radiation pattern is no more than 5 angular degrees. Consider the time frame of the signal determined by the BP of the telescope with a diffuse radiation source on the Sun.
Amplitude characteristic. Let us assume that the emitter located on the Sun is a diffusely emitting surface. In the direction making an angle α with the normal to the surface, the radiation flux density I0 is defined as I0Cos α, that is, the radiation pattern is a circle. The amplitude of the density of the radiation flux from the surface of the Sun, reaching the telescope aperture due to the Earth's orbital motion, practically does not change. Change in amplitude due to change in angle α for a given directional pattern less than 2x10⁻³. The change in amplitude due to the Earth's orbital motion is even smaller. Thus, the change in amplitude due to these factors, with our measurement accuracy, will not be recorded.
Let us consider the measurement results taking into account the influence of the telescope's own BP. The HT telescope is adjusted so that the optical axis of the telescope coincides with the direction to the central part of the solar disk. When the earth moves in orbit, the angle of rotation of the telescope changes, and when it rotates through an angle of ~ 50, the amplitude of the received signal drops significantly. At the Earth's orbital speed of 30 km-1, the planet passes 600 km in orbit in ~ 20 s. If we assume that there is a diffuse emitter on the Sun, then during this time the signal amplitude will practically not change.
The directional diagram of the receiver 50, at this angle, the earth due to the diurnal rotation, when measured in February - 8 hours of the passage of the solar disk across the sky will rotate in a minute by (360/3) / 8x60 = 0.250. And 5 degrees in 20 minutes. Therefore, if there is a diffuse emitter on the surface of the Sun, then the observation time should also be ~ 20 minutes.
Let us determine the width of the BP of the source from the condition that the signal observation time is 20 s. The width of the BP can be determined as follows - For 20 seconds of observation, the Earth travels in orbit a distance of 30 km / s x20s = 600 km. The tangent of the half angle of the width of the DN is defined as - 600 km / 150x106 km = 4x10⁻⁶. Let us assume that the radiator is a cylinder. Hence, it is possible to determine the dimensions of the radiator, whose flow is limited by the walls. From here it is possible to determine the dimensions of the radiator, the ratio of the cylinder radius R to the length L is equal to the tangent of the angle ~ 4x10⁻⁶. Such a radiator is a tube, the length L of which is equal to ~ 0.3 of the solar radius [6], and the radius of R ~ 8.5 km.
Coherent emitter. The width of the BP of a coherent emitter is defined as
Θ ≈ λ / 2R (1)
Where - λ is the radiation wave length, R is the radius of the aperture.
Let us assume that our receiver registers neutrinos with energy of 2 MeV. We also assume that such a source can be represented as a radiator whose wavelength is defined as:
λ = s / ν
ν = E / h
where E- is the neutrino energy, h- is Planck's constant, ν- is the frequency.
For such an emitter ν ~ 10-20 s and λ ~ 10-12 m. The diameter of a source with such a wavelength and an angular width of BP ~ 4 x 10⁻⁶ in accordance with (1) is 2.5 10-7 m. Such parameters determine the nature of neutrino radiation sources in the central zone of the Sun, where the parameters of the medium (hydrogen) allow the existence of a liquid phase. According to observations in the central zone, there are powerful wave processes that partially accompanied by volumetric cavitation.
The collapsing cavitation cavity triggers the hydrogen fusion reaction and serves as a source of neutrinos. As a rule, the characteristic size of such cavities is ~ 10-4.5 cm, which in order of magnitude is in good agreement with the observed data on which the estimates of the source size are based. And finally about amplitude fluctuations. If the source is a source of diffuse radiation, and the number of registered neutrinos is n ~ 102 - 103 units during the measurement time, then local fluctuations are ~ √ n. Figure 7 shows the boundary of the level of fluctuations, obeying the above law.
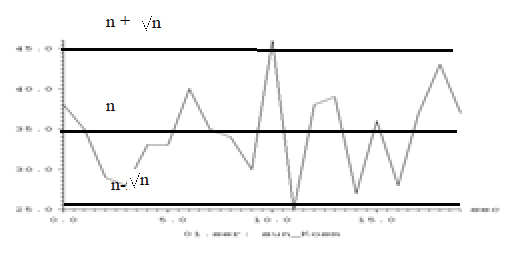
Figure 7: The Boundary of the Level of Fluctuations
For the first time, an attempt has been made to present a picture of neutrino radiation by the Sun (mainly by the central zone) and to make some estimates of the radiation parameters. There are may be exists of the other models.
- Khavroshkin OB, Tsyplakov VV (2019) Anomalous Neutrino Radio Isotope (Anri) Absorption: Capture Section. Applied Physics and Mathematics 1: 3-7.
- Khavroshkin OB, Tsyplakov VV (2018) Anomalous Neutrino Radio Isotope (ANRI) absorption effect: 5 years later. Engineering Physics 7: 14-24.
- Khavroshkin OB, Tsyplakov VV (2013) Radioactivity of an ore sample: monitoring. Engineering Physics 8: 53- 62.
- Khavroshkin O, Tsyplakov V (2013) Sun, Earth, radioactive ore: common periodicity. The Natural Science (NS) 5: 1001-1005.
- Khavroshkin OB, Tsyplakov VV (2017) Cavendish Torsion Balance and Hadron Collider at the Cern: Different Fates and Results. SF J Nucl Sci.
- Khavroshkin OB, Tsyplakov VV (2018) Neutrino Telescope: Problems and Solution. SF J Astrophysics 1: 1-11.
- VE Zharov (2006) Spherical Astronomy. VEK-2.